
The content
posting practices of young people on social networks
Prácticas adolescentes de publicación
de contenidos en redes sociales
 Dr. José Luis Rodríguez-Illera jjlrodriguez@ub.edu. Catedrático de Universidad. Universitat de Barcelona,
España
Dr. José Luis Rodríguez-Illera jjlrodriguez@ub.edu. Catedrático de Universidad. Universitat de Barcelona,
España
Dr. Francesc Martínez-Olmo fmartinezo@ub.edu. Profesor Titular de
Universidad. Universitat de Barcelona, España
Dra. María José Rubio-Hurtado mjrubio@ub.edu. Profesora Titular de
Universidad. Universitat de Barcelona, España
Dra. Cristina Galván-Fernández cgalvan@ub.edu. Profesora lectora. Universitat
de Barcelona, España
Recibido: 2019/09/08
| Revisado: 2019/10/11| Aceptado: 2020/07/02 |
Publicado: 02-01-2021
Cómo citar este artículo:
Rodríguez-Illera,
J.L., Martínez-Olmo, F., Rubio-Hurtado, Mª. J., & Galván-Fernández, C.
(2021). The
content posting practices of young people on social networks. Pixel-Bit.
Revista de Medios y Educación, 60, 135-151. https://doi.org/10.12795/pixelbit.74025
ABSTRACT
We aim to rethink personal digital storytelling in light of new forms
of communication that have emerged on social networks, as well as to analyse
the core value of image in all of them. Three specific objectives are proposed: i) to know the habits and practices of young
people in relation to the publication of digital (and other) narratives in
social networks, ii) to identify profiles and types of young publishers, iii)
to characterize the differentiating elements between the types of young
publishers. For this purpose, we have designed a questionnaire on young
people’s social network posting practices. The sample corresponds to 835 young
people between 12 and 22 years old from Ibero-American countries (Spain, Chile and Colombia). Our analysis of the results of the
questionnaire shows certain differences according to age, country and gender,
along with several significant similarities. The respondents have been
classified according to posting frequency and type
of posts. Last of all, we make some considerations on how to incorporate the
results of the questionnaire in the training methodology of personal digital
storytelling.
RESUMEN
Se propone repensar los relatos digitales personales (RDP) con las
nuevas formas de comunicación que aparecen en las redes sociales, así como
analizar el valor central de la imagen en todos ellos. Se proponen 3 objetivos
específicos: i) conocer los hábitos y prácticas de los jóvenes con
relación a la publicación de narrativas digitales (y de otro tipo) en las redes
sociales, ii) identificar perfiles y tipos de jóvenes publicadores, iii)
caracterizar los elementos diferenciales entre los tipos de jóvenes
publicadores. Para ello, se ha construido una encuesta sobre las formas de
publicación en esas mismas redes. La muestra corresponde a 835 jóvenes de entre
12 y 22 años de países iberoamericanos (España, Chile y Colombia). Los resultados son analizados, obteniéndose algunas diferencias por edad,
país y sexo, si bien con dosis importantes de similitud. Emerge una
clasificación de los encuestados que los distribuye según la frecuencia y el
tipo de publicaciones que realizan. Finalmente, se proponen algunas
consideraciones sobre cómo incorporar los resultados de la encuesta en la
metodología formativa de RDP y en el campo educativo.
PALABRAS
CLAVES · KEYWORDS
digital storytelling; young people; digital practices; social networks;
digital competence
relatos digitales personales; juventud; prácticas digitales; redes
sociales; competencia digital
1.-
Introduction
Personal digital stories come from the oral tradition of autobiographical forms and life stories, which in the 1990s were transformed by the arrival of new technologies and the capacity to easily produce digital photographs and audio-visual materials. A group of social activists of the Center for Digital Storytelling at Berkeley (Lambert, 2013), renamed the StoryCenter in 2015, came up with the idea of producing some short stories, lasting around three or four minutes, by holding a series of face-to-face, expert-led workshops. The stories, told in the first person, involved a high degree of engagement by the storytellers and held significance for them.
These personal digital stories have begun
to be disseminated online and something of an international movement has been
created with a similar approach to the original stories: non-interactive,
produced by non-experts, priority given to the content (story) being told and
only moderate attention paid to aesthetic and technological aspects. Personal
digital stories express the storyteller’s point of view and voice and are
clearly very subjective. In other words, and from a positive perspective, they
give voice to those who do not normally have one (Burgess, 2006), maintaining
the formal and content-related aspects of personal and autobiographical stories
(Rodríguez-Illera, 2014). In recent years they have generated new theoretical
interest (Erstad & Silseth, 2008; Lundby, 2008) and a good number of
conferences and books have been devoted to the subject (Dunford & Jenkins,
2017; Gregori-Signes & Brígido-Corachán, 2014; Londoño &
Rodríguez-Illera, 2017; Núñez-Janes et al., 2017).
One cannot overstate the importance in
society of the image that creates a kind of spectator audience, a diffused
audience which is always present everywhere and of which we all form a more or
less active part (Abercrombie & Longhurst, 1998). Personal digital stories
occupy a peripheral position in respect of other expressive visual forms, at
least in quantitative terms, perhaps because they explicitly emphasise their
truthful nature, the expression of an aspect of life that is made public and is
disseminated in order to communicate with other people beyond the familiar
environment.
In addition to image and video, the
technological developments of the 21st century have brought about new,
instantaneous forms of communication and interaction, as well as new forms of
connection and ever-present contact through social networks and smartphones. We
believe that this constitutes a new and profound change for personal stories,
including exclusively text-based stories, in the form of instant messages or on
the personal pages of a social network (Facebook, Twitter, WhatsApp, Instagram
and various others). It is a type of change that is taking place in several
other environments, made possible by technology, even if it plays a secondary
role to social aspects; in other words, a shift is taking place from interaction
between machines and people to interaction between people as the core element,
and from interaction to participation in larger human groups.
This phenomenon has led to an exponential increase
in the number of stories found on networks. The stories tend to be shorter,
even containing ephemeral content or abbreviated forms of conventional
storytelling. This becomes immediately evident in a comparison between literary
autobiographies, digital stories and Instagram stories. This increasingly
reduced length is typical of a general movement that shortens but also
simplifies what is being told. Nevertheless, stories told with images continue
to generate a great deal of interest, including those solely featuring still
images as selfies (Warfield, 2015).
These changes in forms of communication, mostly incorporated through social networks, have led us to try to better understand the meaning that young users attach to messages of this kind, especially narrative ones. Although communication patterns between young people have been widely studied, the same cannot be said for personal stories, which remain very similar in conception and in practice to those that were being created more than 20 years ago. Therefore, as we explain below, we have carried out a review of the methodology of traditional personal stories, focusing in particular on their application in formal education, in order to design a questionnaire aimed at trying to find out what young people’s current practices are.
More specifically, the objectives are:
§ To
know what young people’s habits and practices are in relation to the posting of
digital stories (and other types) on social networks.
§ To
identify profiles and types of young posters.
§ To
characterise the elements that differentiate the various types of young
posters.
2.- Methodology
We conducted a survey-based study by means of an online questionnaire that was answered by young people aged between 12 and 22 years old, always in the presence of a member of the research team, between December 2017 and April 2018. The dimensions of the questionnaire are related to aspects that describe traits and behaviours that are significant for the studied phenomenon, such as:
Sociodemographic
characteristics (age, gender, country, education), technological capital and
networks on which respondents have accounts.
Posting
habits: posting frequency and types of post, posting of ephemeral content (type
of content), what respondents add to their posts (themes and elements they
include), with whom they share their posts, being fans/posting on what they are
fans of, knowledge of their followers, source of the content they post,
preparation of posted content, time devoted to creating and posting (editing
time and posting time), topics of posts, frequency with which they post from
each device.
2.1.- Participants
The respondents were selected by means of
a convenience sample made up of 835 young people from Spain (45%), Chile (30%)
and Colombia (25%). Considering a confidence interval of 95% for infinite
populations, where p and q = 0.5, the margin of error in a random sample is ±
3.4%.
Among the respondents, 49.9% identify as
female, 49.5% identify as male and 0.6% identify as non-binary. The average age
of the sample is 16.7 years and almost all the respondents (831 subjects) have
completed studies of one kind or another (from secondary education to
post-compulsory higher education).
Around 92% of the participants possess a computer, 96% have a smartphone, 57% have a tablet, 70.5% state that they have a smart TV (shared with the family) and 93% have an internet connection at home.
The main networks on which they have a
user account are WhatsApp (97.2%), email (92.1%), Instagram (88.5%), Facebook
(76.3%) and YouTube (72.0%). These are followed by a group of networks with a
smaller but still significant number of user accounts among the sample:
Snapchat (54.1%), Skype (52.0%) and Twitter (38.8%). Last of all, the networks
and content applications with a relatively small following are Musical.ly (18.0%),
Blog (17.2%), Telegram (10.3%), Website (6.7%) and Wiki (2.3%).
2.2.- Data
analysis
We used descriptive statistics and mean
comparisons to analyse the data (with robust tests –Mann-Whitney U test– since
the variables do not meet all the parametric assumptions), as well as
proportion tests (C2
). To identify the differential profiles of young producers of digital stories,
we applied the two-step cluster technique. This multivariate classification
technique carries out an analysis designed to detect natural groupings in a
data set (Pérez, 2011). Our aim was to find the best model to classify and
characterise young storytellers, on the basis of the variables related to the
type of content posted by young people and to the posting frequency:
composition of photos or collages, photo gallery, music, individual and/or
group selfies, texts on things that I think or things that happen to me, texts
on things that happen in my environment, videos in which I appear, live videos,
and others (memes, GIFs, etc.).
3.- Results
3.1.-The posting practices of young people on social networks
The posting frequency in general is low,
given the high percentage of respondents who never post, as can be seen in
Table 1. The main types of post are photos and selfies. Ranked below these
types of post (see Table 1).
78.9% of the respondents are fans of
something or someone, but only 21.4% have produced and posted related content.
The posting of ephemeral content (which is
deleted after a certain amount of time) is moderate: 36% of respondents post
such content frequently or very frequently, while only 8.6% always post it.
33.3% of respondents seldom post such content and 22% never do so.
77% of posters create their own content
while 39.52% obtain it from the internet. 61.1% of respondents usually prepare
(edit, adjust) the content they post. 34.4% of respondents devote between one
and four minutes to creating and posting a piece of content, followed by 29%
who devote less than a minute to these tasks and 23% who devote between four
and nine minutes to them. Only 9.7% devote between ten and 60 minutes to
creating and posting content, while a mere 4% devote more than an hour to these
tasks.
The main topics about which the
respondents post are hobbies, tastes and passions (65.8%), followed by places
and spaces (54.1%), important people in their lives (48.7%), aspects of daily
life (47.2%) and important events in their lives (38.4%). A lower percentage of
respondents post content on personal reflections (22.9%), relationships
(21.2%), dreams or personal wishes (15.3%), learning processes, discoveries or
knowledge (12.0%), items or objects of sentimental value (11.6%), and
work-related or professional activities (11.0%).
Types
of post and posting frequency
|
Types of post |
Posting frequency |
|||
|
|
Never |
Monthly |
Weekly |
Daily |
|
Photos |
11.5% |
54.5% |
28.4% |
5.6% |
|
Individual selfies |
34.4% |
40.5% |
19.2% |
6% |
|
Group selfies |
26.8% |
47.9% |
19.5% |
5.7% |
|
Collage |
70.7% |
22.5% |
6.1% |
0.7% |
|
Photo gallery |
60.6% |
26.9% |
5.7% |
0.7% |
|
My videos |
62% |
27.5% |
7.5% |
2.9% |
|
Live videos |
78.6% |
16.2% |
3.7% |
1.6% |
|
Texts on aspects of my life |
69.1% |
18.8% |
8% |
4.1% |
|
Texts on my environment |
69.3% |
18.7% |
8.1 |
3.8% |
|
Texts on fictions |
75.7% |
14% |
6.9% |
3.4% |
|
Music |
70.3% |
14.7% |
7.5% |
7.4% |
|
Others (memes, GIFs) |
50.4% |
20.6% |
12.1% |
16.9% |
The time of day at which respondents post content are very similar between weekdays and weekends and are classified from higher to lower frequency as follows: in the afternoon, in the evening, at midday and in the morning and just after waking up.
64%
of respondents usually share the content they post exclusively with contacts
and/or friends, compared with 28.5% who share it with the general public and
7.5% who only share it with a selection of contacts.
53.1%
of respondents personally know almost all of their followers, while 14.7% know
half of them and 16.5% know some of them. Only 10.9% know all of them and a
very small percentage (4.8%) do not know any of them. Furthermore, the
respondents also follow other people, who they may or may not know personally.
WhatsApp (70.9%), Facebook (66.0%) and Snapchat (52.9%) are the three networks
on which the respondents follow profiles that they know personally. Meanwhile,
the three main networks on which most users follow profiles that they do not
know personally are YouTube (54.1%), Instagram (35.1%) and Twitter (26.5%).
The
main device from which content is posted is the smartphone (88%), followed at
some considerable distance by the laptop, the tablet and the desktop computer,
from which only 12.8%, 10.4% and 5.4%, respectively, post frequently.
3.2.-
Poster profiles
We have been able to classify the 835 respondents into four types of poster. We have carried out the assignment to groups through the two-step cluster technique (Rubio & Vilà, 2016), after completing a regression analysis to identify the variables with a greater predictive degree when it comes to identifying the posting level of each respondent. For the two-step algorithm, we have entered the 12 variables that make up the question corresponding to the frequency with which each type of content is posted1 , which, ranked in order from greater to lesser importance as predictors of the clusters, are as follows: photos, texts on the respondent’s environment, others, individual selfies, group selfies, personal texts, music, personal videos, fiction texts, collages, live videos and photo galleries. The said algorithm has generated four clusters with a good quality index (silhouette measure of cohesion and separation = 0.5). We confirmed the assignment of respondents to each group by means of calculation with the matrix randomly reordered on three occasions and through the index of agreement (kappa = 0.739; p = 0.000) between the assignment of the two-step algorithm and another cluster technique (in this case a hierarchical cluster was applied). As such, we were able to identify the groups listed in Table 2.
Groups
identified according to the content they post
|
Type of poster |
Freq. |
Percentage |
|
Seldom posts (SP) |
308 |
36.9 |
|
Usually posts
photographic and video content (PSV) |
296 |
35.4 |
|
Usually posts text-based,
music-related or other content (GIFs, memes…) (TMO) |
139 |
16.6 |
|
Usually posts all sorts
of content (AS) |
92 |
11.0 |
|
Total |
835 |
100.0 |
Over the course of the study we will refer to the type of poster according to the following key:
Key for type of poster: SP= Seldom posts;
PSV= Posts photos, selfies and videos; TMO= Posts texts, music and other
content; AS= Posts all sorts of content
The age distributions for each type of
poster do not match the normal curve. Significant differences have been found
in average ages (Kruskal–Wallis H test = 10.415; df = 3; p = 0.015): the group
that posts all sorts of content tends to be a little older than the other types
of poster (see Table 3).
Table 3
Age
of each type of poster
|
Type
of poster |
Average |
Standard
Deviation |
|
Seldom
posts |
16.5 |
2.59 |
|
Usually posts photographic and video
content |
16.5 |
2.48 |
|
Usually posts text-based,
music-related or other content (GIFs, memes…) |
16.6 |
2.20 |
|
Usually posts all sorts of content |
17.4 |
2.38 |
|
Total |
16.7 |
2.47 |
As regards gender, differences have been detected in the types of poster according to this variable (for this calculation five case have been rejected in which the others option was selected in the question about gender; Chi-Square = 13.370; df = 3; p = 0.004; contingency coefficient = 0.126). The type of poster of photographic and video material is characterised by being a mostly female group while the type of poster of text-based, music-related or other content is a mostly male group (see Graph 1)
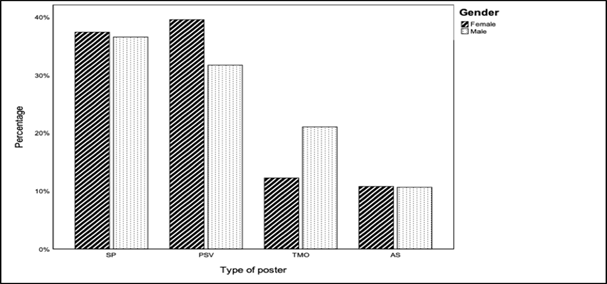
Graph 1. Distribution of type of poster by gender
As far as countries are concerned, the
respondents from Colombia stand out in respect of those from the other two
countries in terms of posting little or very little, while those from Spain
stand out in respect of those from the other two countries in terms of posting
mostly photos, selfies or videos, or not posting anything at all, and those
from Chile stand out in respect of those from the other two countries in terms
of posting all sorts of content (ChiSquare = 25.192; df = 6; p = 0.000;
contingency coefficient = 0.171).
3.3.- Characterisation of types of poster
In the following sections we describe the
characterisation differentiated according to types of poster.
3.3.1.
Networks on which they have an account
The
analysis of networks on which each type of poster has an account has detected
significant relations in the cases shown in Table 4. For the WhatsApp,
Telegram, blog and email networks, no significant differences have been found.
The type of poster who posts photographic and video content has accounts on the
following networks in particular: Instagram, SnapChat, Skype and Musical.ly.
The type of poster who posts text-based, music-related or other content has
accounts on the following networks in particular:
Facebook, Twitter, YouTube, website and wiki. And, the more general type of poster has an account on all the networks.
Table
4
Networks on which respondents
mostly have accounts according to type of poster
|
|
SP |
PSV |
TMO |
AS |
Chi2 |
p |
C |
|
Facebook |
|
|
Yes |
Yes |
17.728 |
0.001 |
0.144 |
|
Twitter |
|
|
Yes |
Yes |
14.804 |
0.002 |
0.132 |
|
YouTube |
|
|
Yes |
Yes |
10.667 |
0.014 |
0.112 |
|
Website |
|
|
Yes |
Yes |
17.856 |
0.000 |
0.145 |
|
Wiki |
|
|
Yes |
Yes |
16.689 |
0.001 |
0.140 |
|
Instagram |
|
Yes |
|
Yes |
21.040 |
0.000 |
0.157 |
|
SnapChat |
|
Yes |
|
Yes |
40.322 |
0.000 |
0.215 |
|
Skype |
|
Yes |
|
Yes |
8.809 |
0.032 |
0.102 |
|
Musical.ly |
|
Yes |
|
Yes |
19.139 |
0.000 |
0.150 |
Note: the
degrees of freedom for all the Chi-Square tests are 3.
3.3.2.
Length of time devoted to social networks
In
respect of the time devoted to social networks, whether on weekdays or at the
weekend, we have observed significant differences (on weekdays: Kruskal-Wallis
H = 55.267; df = 3; p = 0.000, at the weekend: Kruskal-Wallis H = 43.621; df =
3; p = 0.000), which means that the group that seldom posts (SP) tends to
devote fewer hours to networks (most of this group devotes between less than
one hour and three hours to networks on one weekday; and between one and five
hours on one day at the weekend) while the group that usually posts all sorts
(AS) tends to devote more hours to networks than the other groups (most of this
group devotes between one and five hours to networks on one weekday; and more
than five hours on one day at the weekend).
3.3.3.
Knowledge of their followers
The
type of poster is related to the degree to which they know their followers.
Those who seldom post content know their followers to a greater degree, while
those who mostly post text-based, music-related and other content, along with
those who post all sorts of content, known their followers to a lesser degree
(Kruskal-Wallis H = 35.643; df = 3; p = 0.000) (see Graph
2).
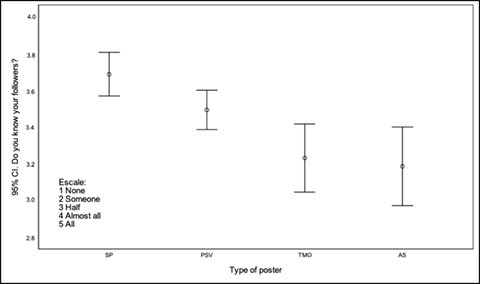
Graph 2. Distribution of type of poster by gender
3.3.4. With whom they share
their posts
Statistically
significant differences exist (Chi-Square = 31.623; df = 6; p = 0.000), between
types of poster according to whom they share their posts with. As such, we have
observed that the group that seldom posts anything only shares content with a
selection of contacts, while the groups that post photos, selfies, videos,
texts, music and other content mostly share their posts with everybody
(publicly) or only with their contacts or friends, and the group that posts all
sorts of content mostly shares posts with everybody or only with a selection of
contacts
3.3.5. What they add to their posts
Most
of those who post photos, selfies or videos, along with those who post all
sorts, very frequently or always use short texts, emojis, geotags or mentions
to other people in order to add to their posts (see Table 5)
3.3.6. Source of the posted
content
Most
of those who create the content they post belong to the group that posts
photos, selfies or videos (Chi-Square = 18.053; df = 3; p = 0.000; contingency
coefficient = 0.145). The groups that tend to obtain content from the internet
and that retweet, repost, copy or share with other contacts the content they
post are those which mostly post texts, music or other content, and those that
post all sorts of content (Chi-Square = 44.378; df = 3; p = 0.000; contingency
coefficient = 0.225).
Table 5.
Percentage of respondents who very
frequently or always use elements in their posts
|
|
SP |
PSV |
TMO |
AS |
Chi2 |
p |
C |
|
Short texts |
11 |
17 |
12 |
46 |
92.177 |
0.000 |
0.315 |
|
Emojis |
31 |
60 |
32 |
71 |
115.318 |
0.000 |
0.348 |
|
Geotags |
9 |
22 |
6 |
27 |
83.036 |
0.000 |
0.301 |
|
Hashtags |
7 |
13 |
8 |
21 |
57.908 |
0.000 |
0.255 |
|
Mentions to others |
32 |
50 |
28 |
61 |
85.828 |
0.000 |
0.305 |
Note: the
degrees of freedom for all the Chi-Square tests are 12.
3.3.7. Posting of ephemeral
content
The
frequency with which ephemeral content is posted is greater in the group that
posts photos, selfies or videos and in that which posts all sorts of content
(Kruskal-Wallis H = 127.456; df = 3; p = 0.000) (see Graph 3)
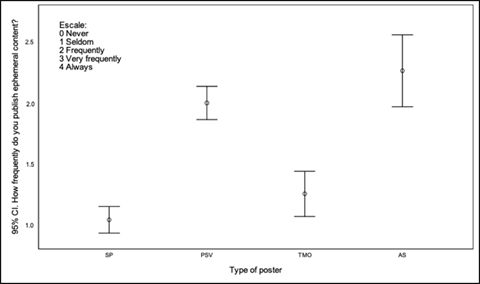
Graph 3.
Frequency with which ephemeral content is posted according to the type of
poster
3.3.8. Preparation of posted
content
The
group that mostly posts photos, selfies or videos tends to prepare with greater
frequency the content it posts than the rest of the groups (Chi-Square =
44.136; df = 3; p = 0.000; contingency coefficient = 0.224).
3.3.9. Time devoted to
creating and posting
As
regards the approximate amount of time devoted to creating and posting content,
we have detected significant differences (Kruskal-Wallis H = 21.793; df = 3; p
= 0.000): those who seldom post content devote less time to creating and
posting (most of them between less than one minute and four minutes), while
those who usually post all sorts of content tend to devote more time to their
posts (most of them between one and nine minutes).
3.3.10. Topics of posts
The
group that mostly posts photos, selfies or videos does so on the topic of
places and spaces with greater frequency than the rest of the groups. The group
that mostly posts textbased, music-related and other content and the group that
posts all sorts of content tend to do so on the topic of hobbies and tastes
with greater frequency than the rest of the groups. The group that posts all
sorts of content tends to post on the rest of the topics asked about in the
questionnaire with greater frequency than the rest of the groups (see Table 6).
Table 6.
Percentage of topics addressed in
content for each type of poster
|
|
SP |
PSV |
TMO |
AS |
Chi2 |
p |
C |
|
Work-related
activities |
9 |
10 |
6 |
27 |
29.102 |
0.000 |
0.184 |
|
Hobbies
or tastes |
57 |
66 |
76 |
78 |
23.345 |
0.000 |
0.165 |
|
Important
events |
30 |
46 |
30 |
53 |
27.725 |
0.000 |
0.179 |
|
Places
and spaces |
44 |
64 |
48 |
63 |
28.525 |
0.000 |
0.182 |
|
Items
of sentimental value |
6 |
12 |
13 |
29 |
39.576 |
0.000 |
0.213 |
|
Important
people |
39 |
58 |
42 |
63 |
31.720 |
0.000 |
0.191 |
|
Learning
or knowledge |
7 |
10 |
14 |
32 |
41.495 |
0.000 |
0.218 |
|
Personal
reflections |
14 |
21 |
24 |
54 |
65.158 |
0.000 |
0.269 |
|
Relationships |
15 |
23 |
19 |
39 |
26.765 |
0.000 |
0.176 |
|
Personal
wishes |
9 |
13 |
23 |
32 |
34.636 |
0.000 |
0.200 |
|
Daily
life |
34 |
54 |
45 |
74 |
53.002 |
0.000 |
0.244 |
Note:
the degrees of freedom for all the Chi-Square tests are 3.
3.3.11. Frequency with which
respondents post from each device
Significant
differences have been found2 according to the type of poster in terms of the
frequency with which respondents post from different devices (desktop computer,
laptop, tablet or smartphone). Most of the respondents never use a desktop
computer or laptop, although the groups that posts text-based, music-related
and other content, and the group that posts all sorts of content use these
devices more than the other groups. The smartphone is the most frequently used
device by all the groups of posters. However, the groups that post photos,
selfies and videos, and the group that posts all sorts of content, use it more
frequently than the other groups. Last of all, we consider it necessary to
indicate that we have not found any specific characterisations (that is, with
significant differences) in the following cases:
- Being a fan of a story
-
Having posted content related
to what/whom one is a fan of
-
Having a WhatsApp account
-
Having a Telegram account
-
Having a blog account
-
Having an email account
-
Posting in the afternoon on
weekdays or at the weekend
-
Posting in the evening on
weekdays or at the weekend
-
Having a smartphone
-
Having a computer at home
-
Having an internet connection
at home
-
- Having a smart TV at home
4.- Discussion
Although these results are
based on a moderate sample of users, they are congruent with other research and
also show us that young people behave similarly in different countries despite
their differences.
5.- Conclusions
Generally speaking, young people are more consumers than posters. The passive/active internet user or consumer/prosumer dichotomy (Tapscot, 1995; Toffler, 1980) has been widely discussed in respect of the possibilities offered by Web 2.0 and social networks, and as such has generated significant expectations in relation to the prosumer group (Aparici & García, 2018; Islas, 2008; Ritzer et al., 2012). However, authors and studies show a different reality. Most internet users post little information; their activity is based on looking at photos, often without sharing their own; listening to music or watching videos, but without leaving comments or signing them by means of social markers; reading tweets and perhaps following a lengthy list of users, but without tweeting. This type of user, also referred to as a lurker (Brown, 2000), is fearful of leaving traces of their internet activity. In contrast to this type of user, active users take on the role of a social subject who creates content in addition to sharing it; a user who is immersed in a social dynamic based on production for exchange (Hernández et al., 2014; Ramírez, 2010).
The most frequent type of post
is the photograph, selfie and video selfie, which is congruent with the
importance of image, as explained above. On social networks, images have
replaced text in many interactions and these interactions are closely
associated with the online habits and behaviours of most young people. As
Sontag (2006) points out, the photograph can be considered an object that
creates the illusion of possession of the depicted experience, place or object.
Fernández and Neri (2008) add that it is not merely a question of capturing the
moment but also of instantly posting it online; that is, an I am being
statement. In respect of selfies, Murolo (2015) argues that the dynamics that
arise in relation to this type of photograph have more to do with a
sociocultural perspective than a technological one, since the telling of a
story that represents the image of oneself in daily life unconsciously
expresses one’s current practices (at the restaurant, at the gym at my graduation
ceremony), personality and personal identity; in a selfie, each person decides
what image to present to the world, and this also encompasses the chosen
background and clothing, and even the digital retouches one applies. To view a
selfie as a personal story is to accept that it has transcended its intrinsic
nature as an image, evolving instead into a communicative artefact that
circulates on social networks. Selfies therefore constitute something more than
mere representation (Gómez & Thornham, 2015); they are little stories
(Georgakopolou, 2016) that emerge as contextualised and co-constructed
presentations of the self, moulded by the media through which they circulate.
In relation to our stated
objective of identifying profiles of young posters and their characterisation,
through the two-step cluster technique we have identified four groups in
respect of types of post and their frequency: a group that seldom posts
content; a group that more frequently posts photographic and video content; a
group that more frequently posts text-based and music-related content; and a
group that posts all sorts of content, this being the smallest group. These
groups possess distinctive characteristics according to the demographic and
contextual variables of the research.
As regards gender, one of the
most significant differences is that young women post more photographic and
video content. This finding coincides with those of studies on the social
networking habits of men and women and shows that young men use social networks
more to have fun, give opinions on issues and produce content, while young
women use them to communicate. Furthermore, young women tend to display
themselves more on social networks through photos and selfies (especially those
aged between 16 and 20 years old) in order to project qualities of beauty
(Manovich, 2013; Porter Novelli, 2012). In respect of country, Chile stands out
as the country where young people post most content in the all sorts category,
while Spain is where they post the most photographic or video content.
It is also noteworthy that the
more time respondents devote to social networks, the greater the variety of
content they post. Therefore, there is a direct correlation between the young
people who invest the most time on social networks and the posting activity on
those networks.
Other characteristics that
differentiate the identified groups are the topics on which they post, the
elements they include in their posts, the type of content and the editing of
this content. As such, as far as topics are concerned, we have found that those
who post content on places and spaces do so using more visual formats (photos,
selfies or videos). These users tend to produce photos, selfies and videos of
the places they visit. They are the creators of this content and usually edit
it (retouching photos, editing videos), as well as embedding short texts,
emojis and mentions to other people. This is also the group that posts
ephemeral content the most, frequently changing photos. In respect of this
aspect, the study by Montes-Vozmediano et al. (2018) ( showed that videos
posted by adolescents focus on places and spaces, mostly having a declarative
structure. Meanwhile, users that post content on hobbies form part of the
text-based, music related or other content group, choosing formats through
which they can write opinions on what they like. These users tend to obtain
content from the internet and to retweet, repost, copy or share with other
contacts the content they post, which is not ephemeral.
Another difference that we
have detected is the degree to which users know their followers and with whom
they share their posts. The less frequently users post content, the more they
share it exclusively with the usual contacts and, therefore, the more they know
their followers. Those who post photos, selfies and videos, and those who post
all sorts of content, tend to share it more with everybody and to know their
followers to a lesser degree. At the same time, they have more followers, since
the more one posts, the more followers one tends to have (Metricool, 2018).
The last distinguishing
element is the device from which content is posted. The smartphone is the
device preferred by all the groups of posters. However, the group that post
photos, selfies and videos, and the group that posts all sorts of content, use
it more frequently than the other groups. The complex ecosystem in which young
people are immersed (instant messaging, forums, blogs, wikis, social networks,
tools for downloading music and series, or for sharing videos and photos, etc.)
requires the application of specific competencies. Young people are generating
and sharing content of different types and levels of complexity, from playing
video games on line to writing fiction, sharing photos on Instagram and videos
on YouTube, explaining ideas on Twitter, etc. A series of skills and elements
of knowledge come into play in these activities, which young people have
acquired outside the academic sphere; for example, from the internet itself,
where all sorts of video tutorials are available. Nevertheless, these skills
are closely associated with technology (for example, creating and modifying
photographic content). In this respect, other pieces of research (Lacasa, 2018)
have identified competencies related to the production, consumption and
post-production of media in the context of youth culture, although unevenly
developed. As such, in the educational community it is necessary to implement
actions geared towards encouraging young people to develop this type of
competencies: competencies that enable users to decode the narrative discourse
in these new media and to create their own, competencies that foster
reflection, participation, engagement and, ultimately, social transformation
through these environments.
One of the strategies is the guided construction of personal digital stories, as has been discussed (Erstad & Silseth, 2008), as well as enabling the expression of one’s own voice (Burgess, 2006; Rodríguez & Anayanzy, 2015), something which achieves good results in both formal and informal education (Londoño & Rodríguez-Illera, 2018). We consider it necessary to adapt this thinking to new posting habits and to the four profiles we have identified and discussed. It is an area that warrants further research.
6.- Funding
Ministerio de
Economia y Competitividad of Spain. Programa Estatal de Fomento de la
Investigación Científica y Técnica de Excelencia. Subprograma Estatal de
generación del conocimiento. Modalidad Proyectos I+D. Project: “Los relatos digitales
en la nueva ecología del aprendizaje“(Ref. EDU2016-76726-P).
References
Abercrombie,
N., & Longhurst, B. (1998). Audiences: A Sociological Theory of Performance
and Imagination. Sage.
Aparici, R., &
García,D. (2018). Prosumidores y emirecs: Análisis de dos teorías enfrentadas. Comunicar, 26(55), 71-79. doi: https://doi.org/10.3916/C55-2018-07
Brown, J. (2000). Growing up: Digital: How the
web changes work, education, and the ways people learn. USDLA Journal, 16(2).
https://bit.ly/2JBUdhH
Burgess,
J. E. (2006). Hearing ordinary voices: Cultural studies, vernacular creativity
and digital storytelling. Continuum: Journal of Media, and Cultural
Studies, 20(2), 201–214. https://doi.org/10.1080/10304310600641737
Dunford,
M., & Jenkins, T. (2017). Digital Storytelling, Form and Content. Palgrave.
Erstad,
O., & Silseth, K. (2008). Agency in digital storytelling: Challenging the
educational context. In K. Lundby (Eds.), Digital storytelling,
mediatized stories: Self representations in new media (pp. 213-232).
Peter Lang.
Fernández-Zalazar
D., & Neri C. (2008). Telarañas del conocimiento. Análisis
de los recursos y aplicaciones didácticas de la web 2. Editorial
Libros y Bytes.
Fontcuberta,
J. (2016). La furia de las imágenes. Galaxia
Gutenberg.
Fuente-Prieto,
J., Lacasa, P., & Martínez, R. (2019). Adolescentes, redes sociales y
universos transmedia: la alfabetización mediática en contextos. participativos.
Revista Latina de Comunicación Social, 74, 172-196. https://doi.org/10.4185/RLCS-2019-1326
Georgakopoulou,
A. (2016). From narrating the self to posting self(ies): A small stories approach
to selfies. Open Linguistics, 2(1),
300-317. http://doi.org/10.1515/opli-2016-0014
Gómez
Cruz, E. (2012). De la cultura Kodak a la imagen en red. UOC.
Gómez, E., & Thornham,
H. (2015). Selfies beyond
self-representation: the (theoretical) f(r)ictions of a practice. Journal of
Aesthetics and Culture, 7(1). https://doi.org/10.3402/jac.v7.28073
Gregori
Signes, C., & Brígido Corachán, A.M. (2014). Appraising Digital
Storytelling across Educational Contexts. Publicacions de la Universitat
de València.
Hernández-Serrano,
M.J., Renés-Arellano, P., Graham, G., & Greenhill, A. (2017). From Prosumer to
Prodesigner: Participatory News Consumption. Comunicar, 25(50), 77-88. https://doi.org/10.3916/C50-2017-07
Hernández, D.,
Ramírez-Martinell, A., & Cassany, D. (2014). Categorizando a los usuarios
de sistemas digitales. Pixel-Bit. Revista de Medios y Educación, 44, 113-126.
http://dx.doi.org/10.12795/pixelbit.2014.i44.08
Instituto Nacional de
Estadística, INE. (2016). Población que usa Internet. https://bit.ly/30fnkhu
Islas,
O. (2008). El prosumidor. El actor comunicativo de la Sociedad de la Ubicuidad.
Palabra Clave, 11(1), 29-39.
Lacasa,
P. (2018). Expresiones del futuro. Cómo se comunicarán las próximas
generaciones. Morata.
Lambert,
J. (2013). Digital storytelling: Capturing lives, creating community. Routledge.
Londoño,
G., and Rodríguez Illera, J.L. (eds) (2017). Relatos digitales en
educación formal y social. Universitat de Barcelona.
Lundby,
K. (2008). Digital storytelling, mediatized stories: Self-
representations in new media. Peter Lang.
Manovich, L., (coord) (2014). Selfiecity.
Nueva York: OFCC. http://selfiecity.net/#intro
Metricool (2018). Estudio de redes
sociales. Como se han usado las redes sociales en el 2017. https://bit.ly/2PR1w9r
Montes-Vozmediano,
García-Jiménez, A., & Menor-Sendra, J. (2018). Los vídeos de los
adolescentes en YouTube: Características y vulnerabilidades digitales. Comunicar,
26(54), 61-69. https://doi.org/10.3916/C54-2018-06.
Murolo,
N. L. (2015). Del mito del Narciso a la selfie. Una arqueología de los cuerpos
codificados. Palabra Clave, 18(3), 676-700. http://dx.doi.org/10.5294/pacla.2015.18.3.3
Nuñez-Janés,
M., Thornburg, A., & Booker, A. (eds.) (2017). Deep Stories. Practicing,
Teaching, and Learning Anthropology with Digital Storytelling. Gruyter.
Pérez,
C. (2011). Técnicas de segmentación. Conceptos, herramientas y
aplicaciones. Gaceta Grupo Editorial.
Porter Novelli. (2012). The digital gender
divide. https://bit.ly/2JLs7AG
Ramírez-
Martinell, A. (2010). Educational Video: Exploring the complex
relationship between production, educational use and audience. Tesis
escrita para obtener el grado de Doctor en Investigación Educativa. Centro de
Tecnologías Avanzadas de Aprendizaje de la Universidad de Lancaster.
Ritzer, G., Dean, P.,
& Jurgenson, N. (2012). The
coming of age of the prosumer. American Behavioral Scientist, 56(4),
379- 398. https://doi.org/10.1177/0002764211429368
Rodríguez
Illera, J.L. (2014). Personal storytelling in the digital society. In C.
Gregori-Signes & A.M. Brígido Corachán (Ed.) Appraising Digital
Storytelling across Educational Contexts (pp. 41-58). Publicacions
de la Universitat de València.
Rodríguez, F., &
Anayanzy, A.R. (2015). ¡Tu voz no es mi voz! Relato digital: alternativa
para la comprensión de la discapacidad intelectual. https://bit.ly/2koWdRg
Rubio, M.J., & Vilà,
R. (2017). El análisis de conglomerado bietápico o en dos fases con SPSS. REIRE
Revista de Innovación y Recerca en Educación, 10(1), 118-126. http://doi.org/10.1344/reire2017.10.11017
Rugg,
L. (1997). Picturing Ourselves: Photography and Autobiography. Chicago
University Press.
Sontag,
S. (2006). Sobre la Fotografía. Alfaguara.
Tapscott,
D. (1995). The digital economy: Promise and peril in the age of
networked intelligence. McGraw-Hill.
Tapscott,
D., & Willliams, A. (2009). Wikinomics. Paidós.
Toffler,
A. (1980). The third wave. Bantam Books.
Universitat de Barcelona.
(2010). Código de buenas prácticas en investigación. Universitat de Barcelona.
Warfield, K. (2015). Digital
Subjectivities and Selfies: The Model, the Self-conscious Thespian and the
#realme. The International Journal of the Image, 6(2),1-16. https://doi.org/10.18848/2154-
8560/CGP/v06i02/44167