
Una propuesta de evaluación de
Recursos Educativos Digitales a través de la metodología fsQCA
longitudinal
A proposal for the evaluation of Digital Educational
Resources
through the
longitudinal fsQCA methodology

 Dra. Cristina
Mendaña-Cuervo. Profesora Titular de Universidad.
Universidad de León, España
Dra. Cristina
Mendaña-Cuervo. Profesora Titular de Universidad.
Universidad de León, España
 Dña. Nieves
Remo-Diez. Profesora ayudante. Universidad de León,
España
Dña. Nieves
Remo-Diez. Profesora ayudante. Universidad de León,
España
 Dr. Enrique
López-González. Catedrático de Universidad. Universidad de
León, España
Dr. Enrique
López-González. Catedrático de Universidad. Universidad de
León, España
Recibido:
2023/05/25 Revisado: 2023/09/23 Aceptado: 2023/11/18 Preprint: 2023/12/15 Publicado: 2024/01/07
Cómo citar este artículo:
Mendaña-Cuervo,
C., Remo-Diez, N., & López-González, E. (2024). Una propuesta de evaluación
de Recursos Educativos Digitales a través de la metodología fsQCA
longitudinal [A proposal for
the evaluation of Digital Educational Resources through the longitudinal fsQCA methodology]. Pixel-Bit. Revista de Medios y Educación,
69, 195-226. https://doi.org/10.12795/pixelbit.100000
RESUMEN
El
uso de las Tecnologías de la Información y Comunicación en el ámbito docente ha
supuesto la proliferación de Recursos Educativos Digitales (REDs) que tratan de fomentar el aprendizaje
autónomo y asíncrono de los estudiantes buscando, a su vez, mejorar el
resultado académico. Sin embargo, en pocos casos se evalúa las consecuencias de
dichos recursos en el proceso de aprendizaje.
En este trabajo, se propone la metodología
fsQCA para establecer las combinaciones de REDs que facilitan la obtención de un mejor desempeño de
los estudiantes, frente metodologías que se basan en el estudio de los efectos
netos de cada recurso. El trabajo se complementa con un análisis para varios
cursos académicos a través de la metodología fsQCA
longitudinal, lo que facilita realizar un análisis en el tiempo, propiciando
una visión dinámica de oportunidad y relevancia de los REDs.
Los resultados de la investigación sugieren que no existe una única combinación
de REDs que conduzcan al éxito, sino que la
utilización de dichos recursos de diferentes formas combinadas permite a los
estudiantes el logro de sus objetivos académicos, concluyendo que la
metodología planteada puede resultar de utilidad para la evaluación de REDs con independencia de la tipología de los mismos.
ABSTRACT
The use of Information and
Communication Technologies in teaching has led to the proliferation of Digital
Educational Resources (DERs) which seek to promote autonomous and asynchronous
learning by students in order to improve academic results.
However, the impact of these resources on the learning process is rarely
evaluated.
In this paper, the fsQCA methodology is
proposed to establish the combinations of DERs which enable students to achieve
better performance, as opposed to methodologies based on the study of the net
effects of each resource. The study is complemented with an analysis for
several academic years through the longitudinal fsQCA
methodology, which helps to conduct an analysis over time, providing a dynamic
perspective of the opportunity and relevance of the DERs. The results of the
research suggest that there is no single combination of DERs leading to
success, but that the use of these resources in different ways combined allows
students to achieve their academic goals, concluding that the methodology
proposed can be useful for the evaluation of DERs regardless of their typology
PALABRAS CLAVES· KEYWORDS
Aula invertida, recursos
educativos digitales, resultado académico, fsQCA
longitudinal, enseñanza superior
Flipped classroom, digital
educational resources, academic performance, longitudinal fsQCA,
higher education
1. Introducción
Los actuales estudiantes
universitarios, considerados nativos digitales
Si bien se considera como característica
intrínseca a esta generación el uso natural de la tecnología y su capacidad
para realizar múltiples tareas, hay autores que ponen en cuestionamiento estas
aptitudes y, por ende, la necesidad de adaptar la educación a ellos
Cada vez es más necesario
entender el entorno de nuestros alumnos, en aras a motivarlos y hacerles llegar
dicho conocimiento. Lo cual plantea, a su vez, la necesidad de adecuarles la
enseñanza con metodologías pedagógicas innovadoras y congruentes con la
idiosincrasia de su realidad, aplicando recursos y materiales educativos en
consonancia con esta nueva realidad.
En este contexto han surgido
metodologías activas y colaborativas
De acuerdo con lo anterior,
en el transcurso de la actividad docente de los autores del presente trabajo se
planteó la oportunidad de adecuar los contenidos, la metodología de enseñanza y
el seguimiento y monitorización particular y personalizada de los estudiantes
con el objeto de afrontar los retos mencionados. En concreto, el esfuerzo
docente se enfocó en contrastar la utilidad de aplicar alguna metodología
activa, habiendo optado por el denominado “Aprendizaje Invertido” o “aula
invertida”, o en el anglicismo generalizado de Flipped
Classroom (FC)
Desde el punto de vista de
la innovación en los recursos docentes y estrategias de enseñanza, la
implementación de esta metodología ha sido realizada desde la perspectiva “los
estudiantes primero”, esto es, considerando a los alumnos como protagonistas, tratando
de potenciar su interactividad en el proceso de enseñanza–aprendizaje. Con este
objetivo, se ha desarrollado un “Espacio Virtual de Aprendizaje (EVA)” en
Moodle (https://sicodinet2.unileon.es), plataforma utilizada genéricamente en
la Universidad de León y que, por tanto, resulta amigable, conocida y cómoda
para los estudiantes. La utilización de una plataforma digital “obliga” a la
elaboración de recursos educativos digitales (REDs),
abriendo un abanico de posibilidades de adaptación al estudiante y
proporcionando respuestas inmediatas a su evolución en el proceso de
aprendizaje. En dicho EVA se registran todos los movimientos que los
estudiantes realizan a lo largo del curso académico con dichos REDs, tales como resolución de cuestionarios, realización
de autoevaluaciones, visualización de vídeos, etc.
Desde el punto de vista
didáctico, la importancia de los materiales y los recursos educativos reside en
que propician un determinado tipo de tareas y ciertas formas de realizarlas,
condicionando los procesos de aprendizaje. De hecho, son un instrumento mediador
entre el sujeto y su experiencia, permitiendo componer situaciones de
aprendizaje. Sin embargo, el esfuerzo de innovación en el diseño,
implementación y desarrollo de los diferentes REDs
puestos a disposición de los estudiantes plantea la duda sobre cuál/es son
aquellos que facilitan el proceso, o bien, qué combinación permite al alumnado
conseguir el éxito académico. En efecto, si bien existe un cierto consenso
sobre la evaluación de los REDs desde la perspectiva
de su calidad, ésta suele centrarse en la adaptabilidad, interactividad,
reusabilidad…, sin indagar sobre el resultado que supone su uso por parte de
los estudiantes.
Por este motivo, el
principal objetivo de este trabajo es contrastar, analíticamente con
evidencias, la utilidad y validez de los distintos REDs
desarrollados para facilitar el resultado deseado en un ámbito de “aprendizaje
invertido”. En este sentido, se plantea evaluar la relación entre la
utilización de diferentes REDs puestos a disposición
del alumnado y el resultado obtenido en el proceso de evaluación continua. A
este respecto, cabe señalar que la utilización por parte de los estudiantes de
un único RED por sí solo (como condición antecedente) no será suficiente para
obtener un buen resultado (rendimiento académico), por lo que se propone la
utilidad del análisis configuracional mediante el denominado “Análisis
cualitativo comparativo de conjuntos borrosos” (fuzzy-set Qualitative Comparative Analysis, fsQCA) para
identificar posibles combinaciones de REDs que puedan
conducir a un alto rendimiento académico. Con el objetivo de poder evaluar
posibles variaciones en el tiempo, se considera la oportunidad de utilizar la
metodología fsQCA longitudinal, analizando un periodo
de 4 cursos académicos. Además, en este trabajo se sigue un método inductivo,
en consonancia con la literatura que utiliza esta metodología
2. Metodología
2.1. Proceso de
implementación de la metodología de aula invertida o FC
La investigación educativa
actual parece demostrar que, si los estudiantes tienen la oportunidad de
revisar los conceptos teóricos clave antes de la clase, la sesión presencial se
puede utilizar de manera más efectiva para el aprendizaje activo mediante el
análisis y sobre todo la aplicación práctica de dichos conceptos. Bajo esta
premisa surge el aula invertida, que supone cambiar la dinámica activa del
proceso de aprendizaje, trasladando el protagonismo a los estudiantes que han
de anticipar su trabajo al propio desarrollo docente en el aula.
En su puesta en práctica, el
FC implica un cambio en el diseño metodológico, combinando la instrucción
directa con el trabajo previo de los alumnos, lo que hace variar la dirección
en la que el docente plantea el proceso. El proceso de aprendizaje implica
actividades diferentes en función de los distintos momentos de tiempo (antes,
durante y después de las sesiones presenciales) que, a su vez, requieren
recursos educativos ad hoc vinculados a la metodología
En nuestro caso, el proceso
de implantación de la metodología FC ha supuesto un nuevo diseño metodológico,
no solo por los distintos materiales que han de formar parte del corpus de
trabajo de los alumnos en cada momento de tiempo, sino también por los efectos
que se espera provocar con los mismos. De ahí que haya sido necesario diseñar e
implementar nuevos recursos docentes, mayoritariamente digitales, que faciliten
este proceso para abordar los distintos momentos de tiempo. La Figura 1 muestra
el diseño de implementación que se ha llevado a cabo, donde se detallan los REDs utilizados y puestos a disposición de los alumnos.
Figura 1
Diseño
de la implementación de FC
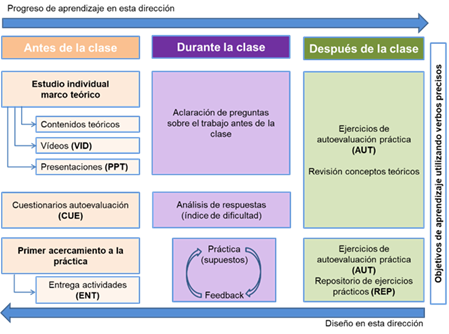
Como se puede observar,
además de los preceptivos contenidos teóricos y de los supuestos prácticos
realizados por los profesores en el aula, los estudiantes disponen de numerosos
y variados recursos digitales, muchos de ellos de carácter voluntario que, a
juicio del profesorado, pueden servir para facilitar el proceso autónomo y
activo de aprendizaje que se pretende favorecer con esta metodología y cuya
evaluación se pretende abordar con este trabajo.
2.2. Muestra
Alumnos de la asignatura
“Contabilidad de Costes” del Plan de Estudios del “Grado en Administración y
Dirección de Empresas” de la Universidad de León, desde el curso 2019-2020
hasta el curso 2022-2023. Del total de alumnos matriculados en cada curso, solo
se han considerado en el estudio aquellos que se han presentado a las pruebas
de evaluación y, por tanto, figuran con calificación en las actas finales. Los
datos de alumnos matriculados vs presentados en cada curso se muestran en la
Tabla 1.
Tabla 1
Datos
de la muestra para cada periodo (curso)
|
|
|
Matriculados |
Presentados |
|||||
|
Curso 2019-2020 |
Total Hombre Mujer |
80 38 42 |
47.50% 52.50% |
|
|
64 29 35 |
45.31% 54.69% |
|
|
Curso 2020-2021 |
Total Hombre Mujer |
95 46 49 |
48.44% 51.58% |
|
|
77 37 40 |
48.05% 51.95% |
|
|
Curso 2021-2022 |
Total Hombre Mujer |
96 41 55 |
42.71% 57.29% |
|
|
78 31 47 |
39.74% 60.26% |
|
|
Curso 2022-2023 |
Total Hombre Mujer |
80 41 39 |
51.25% 48.75% |
|
|
64 39 35 |
45.31% 54.69% |
|
2.3. Procedimiento de
recogida y análisis de datos
La variable
resultado de nuestra investigación es la calificación obtenida por los
estudiantes en el proceso de evaluación. Por su parte, sin menoscabo de otros
recursos educativos a disposición del alumnado (contenidos teóricos, ejercicios
o supuestos prácticos a resolver en el aula clase), las variables
independientes en este estudio son los REDs a
disposición de los estudiantes para su propio proceso de aprendizaje, es decir,
aquellos que voluntariamente pueden utilizar para su progreso. En concreto, se han
considerado los REDs cuya descripción y simbología se
recogen en la Tabla 2.
Tabla 2
Descripción
de las variables
|
Variables |
Símbolo |
Descripción |
|
Variable dependiente |
|
|
|
Resultado académico |
CAL |
Resultado cuantitativo del
proceso de evaluación continua (calificación obtenida). |
|
Variables independientes |
|
|
|
Actividades
a entregar |
ENT |
Entregas de actividades
prácticas realizadas autónomamente. |
|
Autoevaluación práctica |
AUT |
Cuestionarios de
autoevaluación práctica realizados. |
|
Cuestionarios |
CUE |
Cuestionarios de
autoevaluación teórica realizados. |
|
Presentaciones en PPT |
PPT |
Acceso a las presentaciones
en PowerPoint de los temas del programa. |
|
Vídeos |
VID |
Visualización de un total
de 31 vídeos disponibles. |
|
Repositorio de ejercicios |
REP |
Accesos al repositorio para
la realización de ejercicios (supuestos) de cursos anteriores. |
Como se ha comentado, las
evidencias del trabajo desarrollado por los alumnos se recogen en su totalidad
en el EVA de la asignatura, alojado en Moodle, de forma que los datos sobre la
utilización de los REDs han sido recopilados
directamente de la plataforma.
Por su parte, respecto a la
variable resultado se ha considerado la media de las calificaciones obtenidas
por los estudiantes en las pruebas de evaluación, sin tener en consideración la
actividad realizada durante el curso que, como es preceptivo, se ha considerado
para la nota final. Esto es así en la medida en que la nota final se vería
influenciada por la actividad desarrollada por el alumno con los REDs que se pretende evaluar, mientras que la calificación
media permite conocer únicamente la valoración de los conocimientos
demostrados.
2.4. Análisis cualitativo
comparativo difuso
En la literatura para
realizar estudios como el que se propone en este trabajo, el análisis de
regresión presenta una preponderancia dominante, ya que facilita poder conocer
el efecto de varias variables independientes sobre una variable considerada
dependiente, si bien centrándose únicamente en estimar la presencia o ausencia
de los efectos netos de cada variable independiente sobre la variable
dependiente. Frente a esto, fsQCA es un análisis de
combinaciones de conjuntos difusos de condiciones antecedentes (variables
independientes) que utiliza la lógica booleana en lugar de los métodos
tradicionales para encontrar condiciones causales relacionadas con un resultado
particular (variable dependiente).
Esta metodología a su vez
presenta ventajas sobre al análisis correlacional tradicional como son: (1) las
relaciones de los conjuntos de variables son asimétricas, (2) se asume que
puede haber varias combinaciones de variables independientes que faciliten el
mismo resultado (principio de equifinalidad) y (3) permite encontrar efectos
combinados en el resultado de todas las demás variables y no solo efectos
independientes de cada variable independiente (complejidad causal). Esto es,
para explicar un fenómeno (resultado) se pueden considerar más de una
combinación de variables, ya que el resultado depende de cómo se combinen los
atributos más que de los niveles de atributos individuales per se
El interés de la aplicación fsQCA en el ámbito de las Ciencias Sociales en general
puede entenderse desde una doble perspectiva: por un lado, porque a diferencia
de las técnicas estadísticas tradicionales, permite extraer conclusiones de los
casos particulares y, por otro, porque facilita la incorporación de
valoraciones imprecisas (variables subjetivas o de difícil medida exacta)
obteniéndose en muchos casos relaciones no simétricas, es decir, que pueden
detectarse causas y consecuencias sin que necesariamente se estén produciendo
relaciones de equivalencia (sino solo condiciones necesarias o suficientes).
De esta forma, frente a
otras técnicas, la aplicación de fsQCA posibilita
analizar conjuntamente variables de diferentes tipos (aunque se requieren
transformaciones), permite incorporar características cuantitativas continuas
junto con otras discretas o cualitativas/categóricas, no precisa suponer
independencia entre las variables explicativas, tampoco supone la existencia de
relaciones causa-efecto (pues se considera una lógica asimétrica) y no exige
asumir linealidad u otra relación a priori entre las variables explicativas y
las explicadas, consiguiendo significatividad con pocas observaciones.
El enfoque inicial (QCA),
propuesto por Ragin
Por otra parte, cabe señalar
que, en su operativa, antes de implementar el análisis fsQCA,
se precisa transformar las respuestas obtenidas en conjuntos borrosos o
difusos. Para ello, en primer término, se eliminan los valores perdidos,
procediendo a calibrar los valores de las variables, es decir, determinar el
grado de pertenencia de cada caso a cada clase. Posteriormente, con los datos
calibrados se elabora la tabla de configuraciones (truth table) con el fin de eliminar aquellas combinaciones que no están
presentes en los datos. Esta tabla relaciona las condiciones causales (k
variables independientes) con el resultado (variable dependiente), obteniendo
para cada una de las 2k filas el número de casos que soportan dicha
configuración (frecuencia) así como la consistencia de cada configuración,
entendida como el grado en que esa configuración es un subconjunto del
resultado. Ambos valores deben ser estudiados para establecer umbrales mínimos
en el análisis, que permitan eliminar aquellas combinaciones que no están
presentes en los datos y, por tanto, no se consideran combinaciones causales
empíricamente relevantes.
El objetivo de fijar un
umbral de consistencia es eliminar las combinaciones que, aunque presentes en
los datos, no tengan una consistencia mínima, es decir, se trata de evaluar el
grado en que la evidencia empírica es consistente con la relación teórica
establecida. Esta medida, basada en puntajes de membresía o pertenencia
difusos, se calcula:
 (1)
(1)
donde "min" indica
la selección del menor de los dos valores, Xi representa los puntajes de
pertenencia en una combinación de condiciones, e Yi representa puntajes de
pertenencia en el resultado.
Una vez establecidos los
umbrales mínimos de frecuencia y consistencia, eliminando los casos que no
cumplan dichos mínimos, el procedimiento continúa con la realización del
denominado análisis estándar, que proporciona tres soluciones: compleja,
parsimoniosa e intermedia. Estas soluciones muestran las diferentes rutas que
permiten lograr el resultado, en consonancia con la teoría de la complejidad y
las teorías de la configuración que tienen inherente el principio de
equifinalidad, esto es, la premisa de que múltiples combinaciones de
condiciones antecedentes pueden ser igualmente efectivas
Para cada solución, además
de la mencionada consistencia (ecuación 1), fsQCA
proporciona la cobertura general que describe la medida en que el resultado de
interés puede ser explicado por la configuración y se calcula:
![]() (2)
(2)
Además, esta metodología
plantea también un análisis de la necesidad causal, que permite examinar las
condiciones antecedentes que pudieran ser necesarias para que ocurra el
resultado. En general, una condición es necesaria para un resultado si la
ocurrencia del mismo no es posible sin la presencia de
dicha condición, pero la condición por sí sola no es suficiente para producir
el resultado. En términos de conjuntos borrosos, hay una relación necesaria si
el resultado es un subconjunto de la condición o, en otras palabras, el grado
de pertenencia al resultado es menor o igual que el grado de pertenencia a la
condición.
El proceso de calibración y
el resto del análisis han sido realizados utilizando el software fsQCA 4.0 desarrollado por Ragin
y Davey
3. Análisis y resultados
3.1. Análisis de casos
contrarios
Previo al análisis configuracional
con fsQCA, se ha considerado el trabajo de Pappas y Woodside
En la Tabla 3 se muestran
los hallazgos para el curso 2022-2023, habiendo obtenido resultados similares
el resto de periodos, lo que sustenta la necesidad de
realizar un análisis configuracional al mostrar la existencia de diversas
relaciones entre las variables.
Las evidencias obtenidas en
alguno de los cursos y con alguna de las variables para la muestra total no son
estadísticamente significativas; pero en otros casos el nivel de significancia
estadística implica no aceptar la hipótesis de simetría. Por ejemplo, para las
autoevaluaciones (AUT) (ver Tabla 3), la muestra incluye un 29.69 % de casos
contrarios, 15.63 % de casos con utilización baja/muy baja y rendimiento
alto/muy alto (CAL), y 14.06 % con AUT alta/muy alta y calificación obtenida
baja/muy baja. Así, casi el 30% del total de la muestra de estudiantes en ese
curso evidencia dos relaciones contrarias a la relación simétrica en la que se
presume que el uso elevado de un RED supone una mejor calificación. Para el
resto de variables se obtienen resultados similares.
Tabla 3
Resultados
del análisis de casos contrarios
|
|
CAL |
|
CAL |
|||||||||||
|
AUT |
|
1 |
2 |
3 |
4 |
5 |
PPT |
|
1 |
2 |
3 |
4 |
5 |
|
|
1 |
5 |
4 |
2 |
1 |
3 |
1 |
2 |
2 |
2 |
2 |
3 |
|||
|
|
7.8% |
6.3% |
3.1% |
1.6% |
4.7% |
|
3.1% |
3.1% |
3.1% |
3.1% |
4.7% |
|||
|
2 |
4 |
1 |
6 |
5 |
1 |
2 |
1 |
1 |
3 |
1 |
2 |
|||
|
|
6.3% |
1.6% |
9.4% |
7.8% |
1.6% |
|
1.6% |
1.6% |
4.7% |
1.6% |
3.1% |
|||
|
3 |
0 |
3 |
1 |
1 |
0 |
3 |
4 |
4 |
3 |
3 |
0 |
|||
|
|
0.0% |
4.7% |
1.6% |
1.6% |
0.0% |
|
6.3% |
6.3% |
4.7% |
4.7% |
0.0% |
|||
|
4 |
2 |
4 |
1 |
3 |
7 |
4 |
1 |
3 |
2 |
4 |
4 |
|||
|
|
3.1% |
6.3% |
1.6% |
4.7% |
10.9% |
|
1.6% |
4.7% |
3.1% |
6.3% |
6.3% |
|||
|
5 |
1 |
2 |
2 |
3 |
2 |
5 |
4 |
4 |
2 |
3 |
4 |
|||
|
1.6% |
3.1% |
3.1% |
4.7% |
3.1% |
6.3% |
6.3% |
3.1% |
4.7% |
6.3% |
|||||
|
Phi2=.350; p<.130 |
Phi2=.148; p<.891 |
|||||||||||||
|
|
|
|
|
|
|
|
|
|
|
|
|
|
|
|
|
ENT |
|
1 |
2 |
3 |
4 |
5 |
VID |
|
1 |
2 |
3 |
4 |
5 |
|
|
1 |
5 |
3 |
1 |
1 |
1 |
1 |
4 |
1 |
0 |
3 |
3 |
|||
|
|
7.8% |
4.7% |
1.6% |
1.6% |
1.6% |
|
6.3% |
1.6% |
0.0% |
4.7% |
4.7% |
|||
|
2 |
3 |
3 |
4 |
2 |
0 |
2 |
3 |
0 |
6 |
2 |
2 |
|||
|
|
4.7% |
4.7% |
6.3% |
3.1% |
0.0% |
|
4.7% |
0.0% |
9.4% |
3.1% |
3.1% |
|||
|
3 |
1 |
4 |
1 |
4 |
3 |
3 |
2 |
6 |
2 |
2 |
1 |
|||
|
|
1.6% |
6.3% |
1.6% |
6.3% |
4.7% |
|
3.1% |
9.4% |
3.1% |
3.1% |
1.6% |
|||
|
4 |
1 |
3 |
4 |
4 |
5 |
4 |
1 |
6 |
3 |
4 |
5 |
|||
|
|
1.6% |
4.7% |
6.3% |
6.3% |
7.8% |
|
1.6% |
9.4% |
4.7% |
6.3% |
7.8% |
|||
|
5 |
2 |
1 |
2 |
2 |
4 |
5 |
2 |
1 |
1 |
2 |
2 |
|||
|
3.1% |
1.6% |
3.1% |
3.1% |
6.3% |
3.1% |
1.6% |
1.6% |
3.1% |
3.1% |
|||||
|
Phi2=.284;
p<.312 |
Phi2=.351;
p<.129 |
|||||||||||||
|
|
|
|
|
|
|
|
|
|
|
|
|
|
|
|
|
CUE |
|
1 |
2 |
3 |
4 |
5 |
REP |
|
1 |
2 |
3 |
4 |
5 |
|
|
1 |
5 |
3 |
1 |
2 |
1 |
1 |
3 |
2 |
3 |
2 |
1 |
|||
|
|
7.8% |
4.7% |
1.6% |
3.1% |
1.6% |
|
4.7% |
3.1% |
4.7% |
3.1% |
1.6% |
|||
|
2 |
1 |
2 |
4 |
1 |
0 |
2 |
1 |
5 |
3 |
3 |
3 |
|||
|
|
1.6% |
3.1% |
6.3% |
1.6% |
0.0% |
|
1.6% |
7.8% |
4.7% |
4.7% |
4.7% |
|||
|
3 |
3 |
6 |
4 |
2 |
1 |
3 |
3 |
2 |
3 |
3 |
2 |
|||
|
|
4.7% |
9.4% |
6.3% |
3.1% |
1.6% |
|
4.7% |
3.1% |
4.7% |
4.7% |
3.1% |
|||
|
4 |
2 |
3 |
3 |
7 |
8 |
4 |
2 |
3 |
0 |
2 |
4 |
|||
|
|
3.1% |
4.7% |
4.7% |
10.9% |
12.5% |
|
3.1% |
4.7% |
0.0% |
3.1% |
6.3% |
|||
|
5 |
1 |
0 |
0 |
1 |
3 |
5 |
3 |
2 |
3 |
3 |
3 |
|||
|
1.6% |
0.0% |
0.0% |
1.6% |
4.7% |
4.7% |
3.1% |
4.7% |
4.7% |
4.7% |
|||||
|
Phi2=.427; p<.03 |
Phi2=.133; p<.931 |
|||||||||||||
3.2. Proceso de calibración
Antes de implementar el
análisis configuracional se han transformado los datos en conjuntos difusos,
calibrando los valores de las variables. Si bien es factible utilizar el
conocimiento experto, en el presente trabajo se ha optado por una calibración
directa (Tabla 4), utilizando como umbrales los percentiles 90, 50 y 10
Tabla 4
Calibración
de las variables
|
|
Curso 2019-2020 |
|
Curso 2020-2021 |
|
Curso 2021-2022 |
|
Curso 2022-2023 |
||||||||
|
|
90% |
50% |
10% |
|
90% |
50% |
10% |
|
90% |
50% |
10% |
|
90% |
50% |
10% |
|
CAL |
7.4 |
6.0 |
3.0 |
|
7.1 |
5.4 |
3.4 |
|
6.3 |
5.4 |
3.1 |
|
7.0 |
6.0 |
4.8 |
|
ENT |
12.4 |
10.5 |
7.0 |
|
9.0 |
8.0 |
6.0 |
|
17.0 |
13.0 |
7.0 |
|
14.0 |
12.0 |
8.0 |
|
AUT |
4.4 |
2.0 |
0.0 |
|
2.0 |
0.0 |
0.0 |
|
6.0 |
2.0 |
0.0 |
|
5.0 |
2.5 |
1.0 |
|
CUE |
22.0 |
21.0 |
18.0 |
|
21.0 |
20.0 |
13.0 |
|
11.0 |
9.0 |
5.0 |
|
16.0 |
15.0 |
14.0 |
|
PPT |
3.0 |
1.0 |
0.0 |
|
5.0 |
2.0 |
1.0 |
|
5.0 |
3.0 |
1.0 |
|
6.0 |
4.0 |
3.0 |
|
VID |
22.0 |
20.0 |
19.0 |
|
18.0 |
16.0 |
13.0 |
|
23.0 |
21.0 |
17.4 |
|
30.0 |
28.0 |
25.0 |
|
REP |
33.4 |
12.0 |
5.0 |
|
25.8 |
11.0 |
4.0 |
|
6.0 |
5.0 |
3.0 |
|
33.0 |
13.0 |
7.0 |
Nota: 90% total pertenencia,
50% punto de cruce, 10% no pertenencia
3.3. Análisis de condiciones
necesarias
Este análisis previo plantea
la posibilidad de que alguna variable independiente pudiera ser una condición
necesaria para obtener el resultado, obteniendo que todas las condiciones
tienen un valor de consistencia inferior a .90 (Tabla 5), por lo que no parece
que pudieran ser condiciones necesarias
Tabla 5
Análisis
de condiciones necesarias
|
|
Curso 2019-2020 |
|
Curso 2020-2021 |
|
Curso 2021-2022 |
|
Curso 2022-2023 |
||||
|
Consistencia |
Cobertura |
|
Consistencia |
Cobertura |
|
Consistencia |
Cobertura |
|
Consistencia |
Cobertura |
|
|
ENT |
.7521 |
.7804 |
|
.7399 |
.7534 |
|
.8009 |
.8352 |
|
.7550 |
.7059 |
|
AUT |
.7689 |
.7544 |
|
.8744 |
.7075 |
|
.7228 |
.7553 |
|
.7619 |
.6991 |
|
CUE |
.7816 |
.7622 |
|
.7107 |
.7659 |
|
.7810 |
.8191 |
|
.7710 |
.7231 |
|
PPT |
.6897 |
.7217 |
|
.6487 |
.6859 |
|
.7585 |
.7403 |
|
.6664 |
.6426 |
|
VID |
.7089 |
.7168 |
|
.7549 |
.7755 |
|
.6636 |
.6875 |
|
.6839 |
.6892 |
|
REP |
.7698 |
.7690 |
|
.6589 |
.6806 |
|
.7355 |
.7376 |
|
.6538 |
.6569 |
3.4. Análisis de suficiencia
Con los datos calibrados se
elaboró la tabla de verdad, clasificando los casos por frecuencia y
consistencia, fijando los umbrales para ambos parámetros. En concreto, en base
a la literatura
El análisis estándar propone
tres soluciones (compleja, parsimoniosa e intermedia), habiendo optado por esta
última, ya que la solución compleja es demasiado restrictiva (asume que la
ausencia de casos reales supone ausencia de resultado), mientras que la
parsimoniosa opta por la maximización (asume éxito en ausencia de casos reales)
presentado únicamente las condiciones más importantes (“condiciones
centrales”). Por su parte, la intermedia permite asumir que ciertas
configuraciones causales no recogidas por los casos reales determinan el éxito
Dado que el interés del
estudio se centra en conocer las posibles combinaciones de REDs
que contribuyen al resultado, se considera que cada condición causal debe
contribuir teóricamente al resultado cuando está “presente”, habiendo obtenido
los resultados que se muestran en la Tabla 6 bajo la notación propuesta por Fiss
Tabla 6
Resultados
|
|
2019-2020 |
2020-2021 |
2021-2022 |
2022-2023 |
||||||
|
s1 |
s2 |
s3 |
s4 |
s5 |
s6 |
s2 |
s6 |
s7 |
s2 |
|
|
AUT |
● |
● |
• |
• |
• |
|
• |
|
|
• |
|
ENT |
|
● |
● |
|
● |
● |
● |
● |
|
● |
|
CUE |
• |
|
|
● |
• |
• |
|
• |
● |
|
|
PPT |
|
• |
• |
|
|
|
• |
|
• |
• |
|
VID |
• |
• |
|
● |
|
|
• |
|
• |
• |
|
REP |
● |
• |
|
|
• |
|
• |
|
● |
• |
|
Raw coverage |
.5101 |
.3829 |
.5638 |
.5678 |
.4211 |
.7204 |
.4527 |
.6827 |
.3755 |
.3357 |
|
Unique coverage |
.1466 |
.0193 |
.1091 |
.0807 |
.019 |
.2974 |
.0296 |
.3498 |
.0426 |
.0204 |
|
Consistency |
.8543 |
.8232 |
.8639 |
.8564 |
.8645 |
.8799 |
.8801 |
.8253 |
.8314 |
.8830 |
|
Overall solution Coverage: Consistency: |
.5295 .8501 |
.7057 .8348 |
.7501 .8481 |
.7458 .8123 |
||||||
Nota: los círculos negros indican la
presencia de la condición y los espacios en blanco se refieren a condiciones
que no importan. Los círculos grandes (●) representan elementos centrales
(con una fuerte relación causal con el resultado), mientras que los pequeños
(•) son elementos periféricos que indican una relación más débil.
Se puede observar que en
todos los cursos se obtiene más de una solución, corroborando la idea inicial
de que no existe una única combinación de recursos que permita explicar el
resultado (CAL). En este sentido, la utilización por el estudiante de diferentes
combinaciones de REDs puede permitirle alcanzar el
objetivo.
Con relación a los recursos,
si bien todos los analizados forman parte de alguna solución, cabe destacar que
las entregas de actividades (ENT) forman parte de 7 soluciones y, lo que es más
importante, en todos los casos constituyen una condición central. Los
cuestionarios de autoevaluación práctica (AUT) también se muestran presenten en
7 soluciones, si bien mayoritariamente se considera condición periférica, por
lo que no se le puede otorgar la misma importancia que al anterior recurso. El
resto de REDs analizados no muestran una pauta común,
por lo que sólo son consistentes en las soluciones o combinaciones en las que
aparecen.
El análisis longitudinal
permite observar que la solución s2 se repite todos los periodos, a excepción
del curso 2020-2021, en el que las restricciones derivadas de la pandemia de
Covid-19 (distancia, uso de mascarillas, cuarentenas de estudiantes…) pudieran
explicar la diferencia. En dicha solución, están presentes todos los recursos a
excepción de los cuestionarios de autoevaluación teórica (CUE), lo que podría
cuestionar la utilidad de este recurso. Sin embargo, este recurso está presente
en 6 soluciones, requiriendo menores condiciones causales que la solución s2.
Por ejemplo, en la s6 que se repite en dos cursos, únicamente la combinación de
este recurso con la entrega de actividades (ENT) proporciona también un alto
rendimiento académico.
La diferente combinación de
recursos en estas soluciones también podría deberse a la multiplicidad de
materiales que los estudiantes manejan para aprehender los contenidos teóricos,
ya que además de los contenidos en PDF o tradicionales “apuntes”, tanto los
vídeos (VID) como las presentaciones (PPT) facilitan el estudio de esta parte
de la asignatura. Cabe mencionar que, si bien como es lógico y se refleja en la
Figura 1, los estudiantes disponen de los contenidos teóricos, no se han
considerado al no tratarse de un recurso digital y debido a la dificultad de
cuantificar el uso que los alumnos realizan de los mismos.
Por periodos, en el curso
2019-2020 las dos soluciones propuestas permiten explicar cerca del 53 % del
resultado, con una consistencia del 85 %. Para el resto de cursos
estos parámetros pueden observarse en la Tabla 6, situándose en todos los casos
la cobertura entre el 70-75 % con consistencias entre el 81-85 %. Con relación
a las soluciones particulares, la investigación sugiere que un modelo o
solución es informativo cuando la consistencia está por encima de .74 y la
cobertura está entre .25 y .65
4. Discusión y Conclusiones
En este trabajo se han
evaluado los recursos educativos digitales (REDs) a
disposición del alumnado en un entorno de aula invertida. Para ello, aplicando
el análisis comparativo cualitativo borroso (fsQCA),
se ha tratado de establecer las combinaciones de recursos utilizados por los
estudiantes universitarios que obtienen un resultado positivo en la evaluación
de la asignatura. Además, el análisis longitudinal de varios cursos académicos
facilita una mejor comprensión de la naturaleza de los REDs
en cada caso.
A este respecto, si bien
existen trabajos sobre las pautas para diseñar recursos educativos que
contribuyan al aprendizaje
Proposición 1: La alta utilización de un
RED puede contribuir tanto a un rendimiento alto como bajo (principio de
asimetría).
Otros trabajos utilizan un
análisis de correlación para conocer el efecto neto de cada recurso
Proposición 2: La alta utilización de un
RED, por sí solo, no es suficiente para la obtención de un alto rendimiento
académico (principio de complejidad).
En todos los periodos se
obtiene más de una solución, por lo que se puede concluir también que no hay
una única combinación de REDs que, utilizados
conjuntamente, impliquen la obtención de un buen resultado académico. Esta
circunstancia tiene su lógica en las diferentes formas de aprender de cada
estudiante, por lo que si bien alguna combinación presenta mejores resultados,
como cabría esperar no hay un único camino. Estudios precedentes que analizan
el efecto conjunto de todos los recursos, por ejemplo, en función del tiempo de
uso
Proposición 3: No hay una única
combinación de REDs que implique un alto rendimiento
académico (principio de equifinalidad).
A su vez, el análisis de los
resultados concretos en el caso de estudio ha permitido detectar qué recursos
docentes son utilizados (están presentes en las soluciones) por los alumnos que
han obtenido mejores resultados, lo que facilita establecer hacia dónde ha de
dirigirse el esfuerzo del profesorado en el desarrollo e implementación de REDs para esta asignatura. Así, el recurso ENT sobresale de
los demás, presentando una fuerte relación causal con el resultado en casi
todas las combinaciones obtenidas, en consonancia con el trabajo de Latif y Miles
Proposición 4: Las actividades prácticas
realizadas autónomamente (ENT) es una condición decisiva para la obtención de
un alto rendimiento académico.
El trabajo muestra también
aquellos recursos que, sin embargo, no son considerados de mucha utilidad o, al
menos, su empleo no resulta explicativo en las soluciones obtenidas. A este
respecto, la combinación de todos los recursos analizados, a excepción de los
cuestionarios de autoevaluación teórica (CUE), se repite como solución en todos
los periodos, lo que podría suponer una baja utilidad de este recurso,
nuevamente coincidente con las conclusiones de Latif
y Miles
Aun así, este trabajo
sugiere nuevas líneas de estudio, al objeto de generalizar los resultados aquí
obtenidos. En concreto, se han analizado los recursos existentes, si bien es
posible incorporar otros distintos.
Además, y dado que las
teorías de la configuración se basan en el principio de asimetría causal, según
el cual una condición (o una combinación de condiciones) que explica la
presencia de un resultado puede ser diferente de las condiciones que conducen a
la ausencia del mismo resultado, también cabría proponer ampliar el estudio
para encontrar las configuraciones que expliquen un bajo rendimiento académico.
Por otro lado, se ha
considerado como resultado la media de las pruebas de evaluación presenciales,
surgiendo la posibilidad de llevar a cabo un estudio diferenciado a propósito
de los resultados teóricos y prácticos, lo que permitiría conocer qué recursos
favorecen qué aprendizajes en los alumnos. En esta misma línea, podría resultar
de interés un seguimiento concreto de los estudiantes que permiten obtener las
combinaciones sugeridas por el modelo en cada curso, identificando patrones o
características comunes de los grupos, especialmente comprobando si se trata de
alumnos de primera matrícula o, por el contrario, alumnos repetidores,
entendiendo que los recursos utilizados por unos y otros pueden diferir por el
diferente nivel inicial de conocimientos de que parten.
5. Financiación
Los autores, miembros del
“Grupo de Innovación Docente para el Avance del Aprendizaje Autónomo Guiado
(A3G)”, en el que participan profesores de diferentes Áreas de Conocimiento y
con docencia en Grados distintos, desean agradecer a la Universidad de León la
financiación de este trabajo a través de los Planes de Apoyo a los Grupos de
Innovación Docente de la Universidad de León.
A proposal for the evaluation of Digital Educational Resources through the longitudinal fsQCA methodology
1. Introduction
Today's university students, considered digital natives (Prensky, 2001), demand modifications in
traditional educational developments. In fact, in recent decades there has been
a change in the perception of how the so-called "Gen-Zers"
learn, which has driven the need to adapt such processes to their expectations
(Schwieger & Ladwig, 2018), to their way of learning (Cickovska,
2020; Maquilón Sánchez et al., 2013) and even to
their professional aspirations (Barhate & Dirani, 2022).
While the natural use of
technology and the ability to multitask is considered an intrinsic
characteristic of this generation, there are authors who question these skills
and, therefore, the need to adapt education to them (Kirschner & De
Bruyckere, 2017). But, either because of this circumstance or because of the
general process of digitalisation of society, there
is a widespread assumption that the way of learning has changed, leading in
turn to a mutation in the way of teaching, which has resulted in a proliferation
of publications related to the development and use of digital educational
resources and virtual learning objects (Gutiérrez-González et al., 2023) and
their usability (Estrada-Molina et al., 2022).
There is an increasing need to
understand our students' environment, in order to
motivate them and provide them with this knowledge. Therefore, it is necessary
to adapt the teaching to them with innovative pedagogical methodologies in line
with the idiosyncrasies of their reality, applying resources and educational
materials in accordance with this new reality.
In this context, active and
collaborative methodologies have emerged (Segura-Robles et al., 2020)
suggesting that university teaching should be developed in terms of student
learning, who, after activating a set of competencies fostered by the design of
the educational practice implemented by the teacher, are capable of learning
autonomously (Pérez de Albéniz Iturriaga et al., 2015).
According to the foregoing,
during the teaching activity of the authors of this paper, the opportunity
arose to adapt the contents, the teaching methodology and the particular and personalised monitoring and follow-up of the students in order to face the aforementioned challenges.
Specifically, the teaching effort was focused on contrasting the usefulness of
applying an active methodology, having opted for the Flipped Classroom (FC)
(Bergmann & Sams, 2012).
From the point of view of
innovation regarding teaching resources and teaching strategies, the
implementation of this methodology has been undertaken from the perspective of
"students first", that is, considering the students as protagonists,
trying to enhance their interactivity in the teaching-learning process. With
this objective in mind, a "Virtual Learning Environment (VLE)" has
been developed in Moodle (https://sicodinet2.unileon.es), a platform used
throughout the University of León and which, therefore, is friendly, familiar and comfortable for students. The use of a digital
platform "forces" the development of Digital Educational Resources
(DERs), opening up a range of possibilities for
student adaptation and providing immediate responses to their evolution in the
learning process. This VLE records all the actions that students carry out
throughout the academic year with these DERs, such as solving questionnaires,
taking self-assessments, watching videos, etc.
From the teaching point of
view, the importance of educational materials and resources lies in the fact
that they favour a certain type of tasks and certain
ways of performing them, conditioning the learning processes. In fact, they are
a mediating instrument between the learner and his or her experience, making it
possible to create learning situations. However, the effort to innovate in the
design, implementation and development of the
different DERs made available to students raises the question of which ones
facilitate the process, or which combination allows students to achieve
academic success. Indeed, although there is a certain consensus on the
evaluation of DERs from the perspective of their quality, this tends to focus
on adaptability, interactivity, reusability, etc., without investigating the
results of their use by students.
Consequently, the main
objective of this research is to contrast, analytically and with evidence, the
usefulness and validity of the different DERs developed to enable the desired
result in a Flipped Classroom environment. In this sense, it is proposed to
evaluate the relationship between the use of different DERs made available to
students and the results obtained in the continuous assessment process.
Therefore, it should be noted that the use by students of a single DER on its
own (as an antecedent condition) will not be sufficient to obtain a good result
(academic performance), so we propose the usefulness of configurational
analysis using fuzzy-set Qualitative Comparative Analysis (fsQCA)
to identify possible combinations of DERs which may lead to high academic
performance. In order to be able to evaluate possible
variations over time, the opportunity to use the longitudinal fsQCA methodology is considered, analysing
a period of 4 academic years. Furthermore, this study follows an
inductive method, in line with
the literature using this methodology
(Campbell et al., 2015; Federo & Saz-Carranza, 2018; Haxhi
& Aguilera, 2017), which will
allow us to develop propositions
based on the research findings.En este epígrafe se deben incluir los
fundamentos y el propósito del estudio, utilizando citas bibliográficas, así
como la revisión de la literatura más significativa del tema a nivel nacional e
internacional.
2. Metodology
2.1. Process of implementation of the Flipped Classroom methodology
The current educational
research seems to show that, if students have the opportunity
to review key theoretical concepts before class, the classroom session
can be used more effectively for active learning through the analysis and,
above all, the practical application of these concepts. The Flipped Classroom
arises from this premise, involving a change in the active dynamics of the
learning process, transferring the leading role to the students who have to anticipate their work prior to the actual teaching session
in the classroom.
In its implementation, the FC
represents a change in the methodological design, combining direct instruction
with the students' previous work, which changes the direction in which the
teacher approaches the process. The learning process involves different
activities depending on the different moments in time (before, during and after
the face-to-face sessions) which, in turn, require ad hoc educational resources
linked to the methodology (Ferrando Rodríguez et al., 2023).
In our case, the process of
introducing the FC methodology has involved a new methodological design, not
only because of the different materials to be included in the students' work
corpus at each point in time, but also because of the effects they are expected
to produce. It has therefore been necessary to design and implement new
teaching resources, mostly digital, to support this process in
order to address the different moments in time. Figure 1 shows the
implementation design undertaken, detailing the DERs used and made available to
the students.
Figure 1
FC implementation design
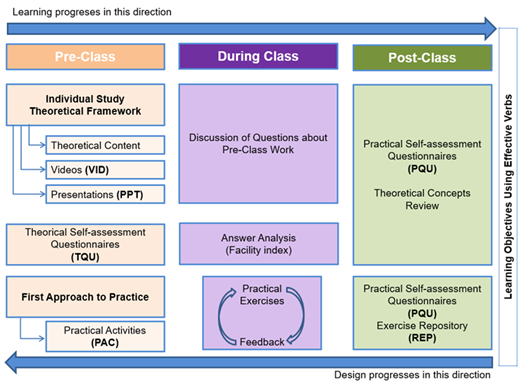
As it can be observed, in
addition to the mandatory theoretical content and the practical exercises
conducted by the teachers in the classroom, the students have numerous and
varied digital resources at their disposal, many of which are voluntary and which,
in the opinion of the teachers, can be used to promote the autonomous and
active learning process that this methodology is intended to encourage and
whose evaluation this study is intended to address.
2.2. Sample
Students of the subject
"Cost Accounting" of the curriculum of the Degree in Business
Administration and Management of the University of León, from the academic year
2019-2020 to the academic year 2022-2023. Out of the total number of students enrolled
in each academic year, only those who have taken the assessment tests and,
therefore, are included in the study with a grade in the final transcripts have
been taken into account. The data for students
enrolled vs. tested in each academic year are shown in Table 1.
Table 1
Data of the sample for each period (academic year)
|
|
|
Enrolled |
Tested |
|||||
|
2019-2020 |
Total Male Female |
80 38 42 |
47.50% 52.50% |
|
|
64 29 35 |
45.31% 54.69% |
|
|
2020-2021 |
Total Male Female |
95 46 49 |
48.44% 51.58% |
|
|
77 37 40 |
48.05% 51.95% |
|
|
2021-2022 |
Total Male Female |
96 41 55 |
42.71% 57.29% |
|
|
78 31 47 |
39.74% 60.26% |
|
|
2022-2023 |
Total Male Female |
80 41 39 |
51.25% 48.75% |
|
|
64 39 35 |
45.31% 54.69% |
|
2.3. Data collection and analysis process
The outcome variable of our
research is the grade obtained by the students in the assessment process.
Meanwhile, without detriment to other educational resources available to
students (theoretical content, exercises or practical
cases to be solved in the classroom), the independent variables in this study
are the DERs available to students for their own learning process, i.e. those
that they can voluntarily use for their progress. Specifically, we have
considered the DERs whose description and symbology are shown in Table 2.
Table 2
Description of variables
|
Variables |
Symbol |
Description |
|
Dependent variable |
|
|
|
Academic performance |
ACP |
Quantitative result of the continuous assessment
process (grade obtained). |
|
Independent variables |
|
|
|
Activities to be submitted |
PAC |
Submissions of practical activities carried out
autonomously. |
|
Practical self-assessment |
PQU |
Practical self-assessment questionnaires completed. |
|
Questionnaires |
TQU |
Theoretical self-assessment questionnaires
completed. |
|
PPT presentations |
PPT |
Access to PowerPoint presentations of the
curriculum's topics. |
|
Videos |
VID |
Visualisation of a total of 31 videos available. |
|
Exercise repository |
REP |
Access to the repository in order
to complete exercises (assumptions) from previous years. |
As previously mentioned, the
evidence of the work developed by the students is collected in its entirety in
the VLE of the subject, hosted in Moodle, so that the data on the use of the
DERs have been compiled directly from the platform.
As for the result variable,
the average of the grades obtained by the students in the assessment tests has
been considered, without bearing in mind the activity carried out during the
course which, as is mandatory, has been taken into account
for the final grade. This is so insofar as the final grade would be influenced
by the activity carried out by the student with the DERs to be assessed,
whereas the average grade only allows us to know the assessment of the
knowledge shown.
2.4. Fuzzy-set qualitative comparative analysis
In the literature, the studies
such as the one proposed in this paper have a dominant preponderance of
regression analysis, since it provides information on the effect of several
independent variables on a variable considered to be dependent, although focusing
only on estimating the presence or absence of the net effects of each
independent variable on the dependent variable. In contrast, fsQCA is an analysis of combinations of fuzzy sets of
antecedent conditions (independent variables) using Boolean logic instead of
traditional methods to find causal conditions related to a particular outcome
(dependent variable).
This methodology in turn has
advantages over traditional correlational analysis such as: (1) the
relationships of the sets of variables are asymmetric, (2) it assumes that
there can be several combinations of independent variables providing the same
outcome (principle of equifinality) and (3) it allows finding combined effects
on the outcome of all other variables and not only independent effects of each
independent variable (causal complexity). In other words, more than one
combination of variables can be considered to explain a phenomenon (outcome),
as the outcome depends on how the attributes are combined rather than on the
levels of individual attributes per se (Greckhamer et
al., 2013; Russo & Confente, 2019; Schneider
& Wagemann, 2010). In this way, it is possible to perform causal
configuration analysis, which addresses cases as "configurations of
causes" and assesses which of these configurations have an influence on
the outcomes to be analysed.
The interest of the
application of fsQCA in the field of Social Sciences
in general can be understood from a double perspective: on the one hand,
because, unlike traditional statistical techniques, it allows conclusions to be
drawn from individual cases and, on the other hand, because it enables the
incorporation of inaccurate assessments (subjective variables or variables
which are difficult to measure exactly), obtaining in many cases
non-symmetrical relationships, i.e. causes and consequences can be detected
without necessarily producing equivalence relationships (but only necessary or
sufficient conditions).
Thus, compared to other
techniques, the application of fsQCA offers the
possibility of jointly analysing variables of
different types (although transformations are required), allows the
incorporation of continuous quantitative characteristics together with other
discrete or qualitative/categorical ones, does not require the assumption of
independence between the explanatory variables, does not assume the existence
of cause-effect relationships (as it is considered an asymmetric logic) and
does not require assuming linearity or any other a priori relationship between
the explanatory and explained variables, achieving significance with few
observations.
The initial approach (QCA),
proposed by Ragin (2000), is based on the traditional set theory, in which
membership is defined in binary terms, an element either belongs or does not
belong to the set (associating values 1 and 0, respectively). However, in the
fuzzy sets (Zadeh, 1965), an element is allowed to belong to a set with a
degree of truth: the value 1 is associated to the elements which most certainly
belong to the set and 0 to those which do not, while the intermediate values
are associated to elements of doubtful membership, so that a degree of
membership is established in the interval 0 to 1. This means that the same
element can also belong to several sets at the same time, with different
degrees of membership. It is exactly this absence of strict limits between sets
which adds flexibility in decision making.
On the other hand, it should
be noted that, in its operation, before implementing the fsQCA
analysis, it is necessary to transform the responses obtained into fuzzy or
fuzzy sets. For this purpose, first of all, missing values are eliminated and the values of the variables are calibrated,
i.e., the degree of belonging of each case to each class is determined.
Subsequently, with the calibrated data, the truth table is drawn up in order to eliminate those combinations which are not
present in the data. This table relates the causal conditions (k independent
variables) with the result (dependent variable), obtaining for each of the 2k
rows the number of cases supporting that configuration (frequency) as well as
the consistency of each configuration, understood as the degree to which that
configuration is a subset of the result. Both values must be studied in order to establish minimum thresholds in the analysis,
which allow us to eliminate those combinations not present in the data and,
therefore, not considered empirically relevant causal combinations.
The aim of setting a
consistency threshold is to eliminate combinations that, although present in
the data, do not have a minimum consistency, i.e. to assess the degree to which
the empirical evidence is consistent with the established theoretical relationship.
This measure, based on fuzzy membership or membership scores, is calculated as
follows:
 (1)
(1)
"min" indicates the
selection of the lower of the two values, Xi
represents membership scores in a combination of conditions, and Yi stands for
membership scores in the outcome.
Once the minimum thresholds of
frequency and consistency have been determined, eliminating the cases which do
not meet these minimums, the procedure continues with the performance of the
so-called standard analysis, which provides three solutions: complex, parsimonious and intermediate. These solutions show the
different routes to achieve the result, in line with the complexity theory and
configuration theories embedded in the principle of equifinality, i.e. the
premise that multiple combinations of antecedent conditions can be equally
effective (Fiss, 2011; Woodside, 2014).
For each solution, in addition
to the aforementioned consistency (equation 1), fsQCA provides the general coverage describing the extent
to which the result of interest can be explained by the configuration and is
calculated:
![]() (2)
(2)
Additionally, this methodology
also poses a causal necessity analysis, which allows for an examination of the antecedent
conditions which might be necessary for the result to occur. In general, a
condition is necessary for an outcome if the occurrence of the outcome is not
possible without the presence of that condition, but the condition alone is not
sufficient to produce the outcome. In terms of fuzzy sets, there is a necessary
relation if the outcome is a subset of the condition or, in other words, the
degree of membership of the outcome is less than or equal to the degree of
membership of the condition.
The calibration process and
the rest of the analysis have been performed using the fsQCA
4.0 software developed by Ragin and Davey (2022).
3. Analysis and results
3.1. Contrarian case analysis
Prior to the configurational analysis
with fsQCA, we have considered the research of Pappas
and Woodside (2021), who suggest a counterfactual analysis, with the aim of
finding out how many cases in the sample are not explained by main effects and
therefore would not be included in the outcome of a typical variance-based
approach. This analysis implies, for all variables, analysing
in both directions the existence of counterfactual cases indicating high scores
for antecedent conditions leading to low outcome scores, and viceversa (Woodside, 2014).
Table 3 shows the findings for
the academic year 2022-2023, having obtained similar results for the remaining
periods, which justifies the need to carry out a configurational analysis by
showing the existence of different relationships between the variables.
The evidences
obtained in some of the academic groups and with some of the variables for the
total sample are not statistically significant; but in other cases, the level
of statistical significance implies not accepting the hypothesis of symmetry.
For instance, for self-assessments (PQU) (see Table 3), the sample includes
29.69 % of contrary cases, 15.63 % of cases with low/very low utilisation and high/very high performance (ACP), and 14.06
% with high/very high PQU and low/very low obtained grade. Thus, almost 30% of
the total sample of students in that group show two relationships contrary to
the symmetrical relationship in which it is presumed that high use of a DER
means a better grade. Similar results are obtained for the other variables.
Table 3
Results of the contrarian cases analysis
|
|
ACP |
|
ACP |
|||||||||||
|
PQU |
|
1 |
2 |
3 |
4 |
5 |
PPT |
|
1 |
2 |
3 |
4 |
5 |
|
|
1 |
5 |
4 |
2 |
1 |
3 |
1 |
2 |
2 |
2 |
2 |
3 |
|||
|
|
7.8% |
6.3% |
3.1% |
1.6% |
4.7% |
|
3.1% |
3.1% |
3.1% |
3.1% |
4.7% |
|||
|
2 |
4 |
1 |
6 |
5 |
1 |
2 |
1 |
1 |
3 |
1 |
2 |
|||
|
|
6.3% |
1.6% |
9.4% |
7.8% |
1.6% |
|
1.6% |
1.6% |
4.7% |
1.6% |
3.1% |
|||
|
3 |
0 |
3 |
1 |
1 |
0 |
3 |
4 |
4 |
3 |
3 |
0 |
|||
|
|
0.0% |
4.7% |
1.6% |
1.6% |
0.0% |
|
6.3% |
6.3% |
4.7% |
4.7% |
0.0% |
|||
|
4 |
2 |
4 |
1 |
3 |
7 |
4 |
1 |
3 |
2 |
4 |
4 |
|||
|
|
3.1% |
6.3% |
1.6% |
4.7% |
10.9% |
|
1.6% |
4.7% |
3.1% |
6.3% |
6.3% |
|||
|
5 |
1 |
2 |
2 |
3 |
2 |
5 |
4 |
4 |
2 |
3 |
4 |
|||
|
1.6% |
3.1% |
3.1% |
4.7% |
3.1% |
6.3% |
6.3% |
3.1% |
4.7% |
6.3% |
|||||
|
Phi2=.350; p<.130 |
Phi2=.148; p<.891 |
|||||||||||||
|
|
|
|
|
|
|
|
|
|
|
|
|
|
|
|
|
PAC |
|
1 |
2 |
3 |
4 |
5 |
VID |
|
1 |
2 |
3 |
4 |
5 |
|
|
1 |
5 |
3 |
1 |
1 |
1 |
1 |
4 |
1 |
0 |
3 |
3 |
|||
|
|
7.8% |
4.7% |
1.6% |
1.6% |
1.6% |
|
6.3% |
1.6% |
0.0% |
4.7% |
4.7% |
|||
|
2 |
3 |
3 |
4 |
2 |
0 |
2 |
3 |
0 |
6 |
2 |
2 |
|||
|
|
4.7% |
4.7% |
6.3% |
3.1% |
0.0% |
|
4.7% |
0.0% |
9.4% |
3.1% |
3.1% |
|||
|
3 |
1 |
4 |
1 |
4 |
3 |
3 |
2 |
6 |
2 |
2 |
1 |
|||
|
|
1.6% |
6.3% |
1.6% |
6.3% |
4.7% |
|
3.1% |
9.4% |
3.1% |
3.1% |
1.6% |
|||
|
4 |
1 |
3 |
4 |
4 |
5 |
4 |
1 |
6 |
3 |
4 |
5 |
|||
|
|
1.6% |
4.7% |
6.3% |
6.3% |
7.8% |
|
1.6% |
9.4% |
4.7% |
6.3% |
7.8% |
|||
|
5 |
2 |
1 |
2 |
2 |
4 |
5 |
2 |
1 |
1 |
2 |
2 |
|||
|
3.1% |
1.6% |
3.1% |
3.1% |
6.3% |
3.1% |
1.6% |
1.6% |
3.1% |
3.1% |
|||||
|
Phi2=.284;
p<.312 |
Phi2=.351; p<.129 |
|||||||||||||
|
|
|
|
|
|
|
|
|
|
|
|
|
|
|
|
|
TQU |
|
1 |
2 |
3 |
4 |
5 |
REP |
|
1 |
2 |
3 |
4 |
5 |
|
|
1 |
5 |
3 |
1 |
2 |
1 |
1 |
3 |
2 |
3 |
2 |
1 |
|||
|
|
7.8% |
4.7% |
1.6% |
3.1% |
1.6% |
|
4.7% |
3.1% |
4.7% |
3.1% |
1.6% |
|||
|
2 |
1 |
2 |
4 |
1 |
0 |
2 |
1 |
5 |
3 |
3 |
3 |
|||
|
|
1.6% |
3.1% |
6.3% |
1.6% |
0.0% |
|
1.6% |
7.8% |
4.7% |
4.7% |
4.7% |
|||
|
3 |
3 |
6 |
4 |
2 |
1 |
3 |
3 |
2 |
3 |
3 |
2 |
|||
|
|
4.7% |
9.4% |
6.3% |
3.1% |
1.6% |
|
4.7% |
3.1% |
4.7% |
4.7% |
3.1% |
|||
|
4 |
2 |
3 |
3 |
7 |
8 |
4 |
2 |
3 |
0 |
2 |
4 |
|||
|
|
3.1% |
4.7% |
4.7% |
10.9% |
12.5% |
|
3.1% |
4.7% |
0.0% |
3.1% |
6.3% |
|||
|
5 |
1 |
0 |
0 |
1 |
3 |
5 |
3 |
2 |
3 |
3 |
3 |
|||
|
1.6% |
0.0% |
0.0% |
1.6% |
4.7% |
4.7% |
3.1% |
4.7% |
4.7% |
4.7% |
|||||
|
Phi2=.427; p<.03 |
Phi2=.133; p<.931 |
|||||||||||||
3.2. Data calibration
Before implementing the
configurational analysis, the data have been transformed into fuzzy sets,
calibrating the values of the variables. Although it is feasible to use expert
knowledge, in this research we opted for a direct calibration (Table 4), using
as thresholds the 90th, 50th and 10th percentiles (Woodside, 2013).
Table 4
Data calibration of variables
|
|
2019-2020 |
|
2020-2021 |
|
2021-2022 |
|
2022-2023 |
||||||||
|
|
90% |
50% |
10% |
|
90% |
50% |
10% |
|
90% |
50% |
10% |
|
90% |
50% |
10% |
|
ACP |
7.4 |
6.0 |
3.0 |
|
7.1 |
5.4 |
3.4 |
|
6.3 |
5.4 |
3.1 |
|
7.0 |
6.0 |
4.8 |
|
PAC |
12.4 |
10.5 |
7.0 |
|
9.0 |
8.0 |
6.0 |
|
17.0 |
13.0 |
7.0 |
|
14.0 |
12.0 |
8.0 |
|
PQU |
4.4 |
2.0 |
0.0 |
|
2.0 |
0.0 |
0.0 |
|
6.0 |
2.0 |
0.0 |
|
5.0 |
2.5 |
1.0 |
|
TQU |
22.0 |
21.0 |
18.0 |
|
21.0 |
20.0 |
13.0 |
|
11.0 |
9.0 |
5.0 |
|
16.0 |
15.0 |
14.0 |
|
PPT |
3.0 |
1.0 |
0.0 |
|
5.0 |
2.0 |
1.0 |
|
5.0 |
3.0 |
1.0 |
|
6.0 |
4.0 |
3.0 |
|
VID |
22.0 |
20.0 |
19.0 |
|
18.0 |
16.0 |
13.0 |
|
23.0 |
21.0 |
17.4 |
|
30.0 |
28.0 |
25.0 |
|
REP |
33.4 |
12.0 |
5.0 |
|
25.8 |
11.0 |
4.0 |
|
6.0 |
5.0 |
3.0 |
|
33.0 |
13.0 |
7.0 |
3.3. Analysis of necessary conditions
This previous analysis raises
the possibility that some independent variable could be a necessary condition
to obtain the result, finding that all the conditions have a consistency value
below .90 (Table 5), so it does not appear that they could be necessary
conditions (Ragin, 2008). Similarly, for the same threshold, the results do not
show that any condition stands out above the rest and could be considered
quasi-necessary (Schneider & Wagemann, 2010).
Table 5
Necessary conditions analysis
|
|
2019-2020 |
|
2020-2021 |
|
2021-2022 |
|
2022-2023 |
||||
|
Consistency |
Coverage |
|
Consistency |
Coverage |
|
Consistency |
Coverage |
|
Consistency |
Coverage |
|
|
PAC |
.7521 |
.7804 |
|
.7399 |
.7534 |
|
.8009 |
.8352 |
|
.7550 |
.7059 |
|
PQU |
.7689 |
.7544 |
|
.8744 |
.7075 |
|
.7228 |
.7553 |
|
.7619 |
.6991 |
|
TQU |
.7816 |
.7622 |
|
.7107 |
.7659 |
|
.7810 |
.8191 |
|
.7710 |
.7231 |
|
PPT |
.6897 |
.7217 |
|
.6487 |
.6859 |
|
.7585 |
.7403 |
|
.6664 |
.6426 |
|
VID |
.7089 |
.7168 |
|
.7549 |
.7755 |
|
.6636 |
.6875 |
|
.6839 |
.6892 |
|
REP |
.7698 |
.7690 |
|
.6589 |
.6806 |
|
.7355 |
.7376 |
|
.6538 |
.6569 |
3.4. Sufficiency analysis
With the calibrated data, the
truth table was prepared, classifying the cases by frequency and consistency,
setting thresholds for both parameters. Specifically, based on the literature
(Fiss, 2011; Ragin, 2008), a minimum frequency of 2 cases and a minimum
consistency threshold of .8 was established.
The standard analysis proposes
three solutions (complex, parsimonious and intermediate), with the latter being
chosen because the complex solution is too restrictive (it assumes that the
absence of real cases means no outcome), while the parsimonious solution opts
for maximisation (it assumes success in the absence
of real cases) by presenting only the most important conditions ("core
conditions"). The intermediate solution assumes that certain causal
configurations not captured by the actual cases determine success (Ragin & Rihoux, 2004) and is therefore the most explanatory
solution.
Since the interest of the
study is focused on finding out the possible combinations of DERs which
contribute to the outcome, it is considered that each causal condition should
theoretically contribute to the outcome when it is "present", having
obtained the results shown in Table 6 under the notation proposed by Fiss
(2011).
Table 6
fsQCA findings
|
|
2019-2020 |
2020-2021 |
2021-2022 |
2022-2023 |
||||||
|
s1 |
s2 |
s3 |
s4 |
s5 |
s6 |
s2 |
s6 |
s7 |
s2 |
|
|
PQU |
● |
● |
• |
• |
• |
|
• |
|
|
• |
|
PAC |
|
● |
● |
|
● |
● |
● |
● |
|
● |
|
TQU |
• |
|
|
● |
• |
• |
|
• |
● |
|
|
PPT |
|
• |
• |
|
|
|
• |
|
• |
• |
|
VID |
• |
• |
|
● |
|
|
• |
|
• |
• |
|
REP |
● |
• |
|
|
• |
|
• |
|
● |
• |
|
Raw coverage |
.5101 |
.3829 |
.5638 |
.5678 |
.4211 |
.7204 |
.4527 |
.6827 |
.3755 |
.3357 |
|
Unique coverage |
.1466 |
.0193 |
.1091 |
.0807 |
.019 |
.2974 |
.0296 |
.3498 |
.0426 |
.0204 |
|
Consistency |
.8543 |
.8232 |
.8639 |
.8564 |
.8645 |
.8799 |
.8801 |
.8253 |
.8314 |
.8830 |
|
Overall solution Coverage: Consistency: |
.5295 .8501 |
.7057 .8348 |
.7501 .8481 |
.7458 .8123 |
||||||
Note: ● = the presence of a core condition; • =
the presence of a peripheral condition; blank spaces indicate conditions
irrelevant to the outcome
It can be observed that in all
the groups more than one solution is obtained, corroborating the initial idea
that there is no single combination of resources to explain the result (ACP).
In this sense, the student's use of different combinations of DERs can allow
him/her to achieve the objective.
Regarding the resources,
although all the resources analysed are part of some
solution, it is worth noting that the submission of activities (PAC) is part of
7 solutions and, more importantly, in all cases it is a central condition. The
practical self-assessment questionnaires (PQU) are also present in 7 solutions,
although they are mostly considered a peripheral condition, so they cannot be
given the same importance as the previous resource. The rest of the DERs analysed do not show a common pattern, so they are only
consistent in the solutions or combinations in which they appear.
The longitudinal analysis
shows that the s2 solution is repeated every period, with the
exception of the 2020-2021 academic year, in which the restrictions
resulting from the Covid-19 pandemic (distance, use of masks, student
quarantines, etc.) could explain the difference. In this solution, all the
resources are present with the exception of the
theoretical self-assessment questionnaires (TQU), which could call into
question the usefulness of this resource. However, this resource is present in
6 solutions, requiring fewer causal conditions than solution s2. For example,
in s6 which is repeated in two groups, only the combination of this resource
with the submission of activities (PAC) also provides a high academic
performance.
The different combination of
resources in these solutions could also be due to the multiplicity of materials
students use to learn the theoretical content, since in addition to PDF content
or traditional "notes", both videos (VID) and presentations (PPT)
help students to learn this part of the subject. It is worth mentioning that,
although it is logical and is reflected in Figure 1, the theoretical contents
are available to students, they have not been considered as they are not a
digital resource and due to the difficulty in quantifying the use that students
make of them.
By periods, in the 2019-2020
academic year, the two proposed solutions explain around 53 % of the result,
with a consistency of 85 %. For the remaining academic years, these parameters
can be observed in Table 6, with coverage in all cases between 70-75 % with
consistencies between 81-85 %. Regarding the particular
solutions, research suggests that a model or solution is informative
when the consistency is above .74 and the coverage is between .25 and .65
(Ragin, 2008; Woodside, 2013), circumstances which are met in all the solutions
obtained.
4. Discussion and
Conclusions
In this paper we have
evaluated the digital educational resources (DERs) available to students in a
Flipped Classroom environment. For this purpose, by applying the fuzzy-set
qualitative comparative analysis (fsQCA), we have
tried to establish the combinations of resources used by university students
who obtain a positive result in the evaluation of the subject. In addition, the
longitudinal analysis of several academic years facilitates a better
understanding of the nature of the DERs in each case.
In this regard, while there is
some work on guidelines to design educational resources that contribute to
learning (Rozo & Real, 2019), with proposals for recommendation systems to
guide students in their learning process (Ndiyae et
al., 2019), there is little research that evaluates the impact of their
combined use on academic performance. In any case, studies focus on student
evaluation through surveys (Drozdikova-Zaripova &
Sabirova, 2020), or on recommending the use of certain resources based on
visits or ratings from other students (Bendjebar et
al., 2023). Furthermore, it is often conducted by analysing
a specific resource, e.g. videos (Hasan et al., 2020; Noetel
et al., 2021) or questionnaires (Sotola & Crede,
2021), trying to identify net effects on academic performance. However, the
analysis of counterfactual cases carried out in this paper has detected that
there are cases which do not support the main effect, i.e. a symmetrical
relationship between academic performance (outcome) and each of the separate
antecedent conditions (DERs), so that the evaluation of a single resource lacks
validity. In fact, in all the periods covered by the study and for all the
variables or resources, it is clear that there are
indeed contrary cases, which makes it possible to suggest that the main effect
of a single resource is not valid:
Proposition 1: High utilisation of a DER can contribute to both high and low
performance (asymmetry principle).
Other studies use a
correlation analysis to determine the net effect of each resource (Okike & Mogorosi, 2020; Soffer & Cohen, 2019), assuming that the use of a resource can have a direct
influence on the result, without considering the joint or combined effect with
the rest of the resources. In this sense, this first proposition ratifies the
need for a configurational analysis such as the one developed in this paper,
which has allowed us to verify the validity of the fsQCA
methodology for the evaluation of teaching resources, regardless of their
typology and the environment in which they are applied. Furthermore, the result
of the analysis of necessary conditions, given that no resource stands out from
the others, ratifies the above and, in turn, allows us to assume:
Proposition 2: The high use of
a DER alone is not sufficient for high academic performance (complexity
principle).
In all periods more than one
solution is obtained, so it can also be concluded that there is no single
combination of DERs which, when used together, implies obtaining a good
academic result. This circumstance has its logic in the different ways of learning
of each student, so that although some combination shows better results, as
might be expected, there is no single approach. Previous studies analysing the joint effect of all resources, for example,
in terms of time of use (Okike & Mogorosi, 2020),
also do not consider which combination(s) of resources might be more conducive
to achieving a good result, as they do not discern the possible choices of
combinations. In this case, on the basis of our
considerations we can propose:
Proposition 3: There is no
single combination of DERs which implies high academic performance
(equifinality principle).
At the same time, the analysis
of the specific results in the case study has made it possible to detect which
teaching resources are used (are present in the solutions) by the students who
have obtained the best outcomes, which makes it easier to establish where the
teachers' efforts should be aimed in the development and implementation of DERs
for this subject. Thus, the PAC resource stands out from the others, presenting
a strong causal relationship with the outcome in almost all the combinations
obtained, in line with the findings of Latif and Miles (2020) regarding the
impact of homework on grades or outcome and with Soffer and Cohen (2019) who
also conclude that homework submission is a significant predictor of
achievement. This allows us to propose:
Proposition 4: Self-directed
practical activities (PAC) is a decisive condition for high academic
achievement.
The study also shows those
resources which, despite this, are not considered to be very useful or, at
least, their use is not explanatory in the solutions obtained. In this respect,
the combination of all the resources analysed, with the exception of the theoretical self-assessment
questionnaires (TQU), is repeated as a solution in all the periods, which could
imply a low usefulness of this resource, again coinciding with the conclusions
of Latif and Miles (2020) as well as Di Meo and
Martí-Ballester (2020). Nevertheless, in combination with certain specific
resources it does facilitate the achievement of the objective (it is part of
other solutions), so it is not possible to assume that it is an ineffective
resource.
In spite of this, this research suggests new lines of study, with the aim of generalising the results obtained here. Specifically,
existing resources have been analysed, although it is
possible to incorporate other, different ones.
Moreover, since the
configuration theories are based on the principle of causal asymmetry,
according to which a condition (or a combination of conditions) explaining the
presence of an outcome may be different from the conditions leading to the
absence of the same outcome, it could also be proposed to extend the study to
find the configurations that explain low academic performance.
On the other hand, the average
of the face-to-face assessment tests has been considered as the result, raising
the possibility of conducting a differentiated study of the theoretical and
practical results, which would make it possible to find out which resources favour which learning processes in the students. Along the
same lines, it could be of interest to monitor the students who obtain the
combinations suggested by the model in each academic year, identifying patterns
or common characteristics of the groups, especially verifying whether they are
first-time students or, on the contrary, repeating students, on the
understanding that the resources used by one or the other may differ due to the
different initial level of knowledge from which they start out.
5. Funds
The authors, members of the
"Teaching Innovation Group for the Progress of Autonomous Guided Learning
(A3G)”, in which professors from different areas of knowledge and teaching in
different degrees participate, would like to thank the University of León for
funding this research through the Support Plans for the Teaching Innovation
Groups of the University of León.
References
Barhate, B., & Dirani, K. M. (2022). Career
aspirations of generation Z: a systematic literature review. European
Journal of Training and Development, 46(1/2), 139–157. https://doi.org/10.1108/EJTD-07-2020-0124
Bendjebar, S., Djebarnia, N. E. I., Mehenaoui,
Z., & Lafifi, Y. (2023). Recommendation of
pedagogical resources based on learners’ profiles. International Journal of
Informatics and Applied Mathematics. https://doi.org/10.53508/ijiam.1213949
Bergmann, J., & Sams, A.
(2012). Flip Your Classroom: Reach Every Student in Every Class Every Day.
International Society for Technology in Education.
Campbell, J. T., Sirmon, D.
G., & Schijven, M. (2015). Fuzzy Logic and the
Market: A Configurational Approach to Investor Perceptions of Acquisition
Announcements. Academy of Management Journal, 59(1), 163–187. https://doi.org/10.5465/amj.2013.0663
Cickovska, E. (2020). Understanding and Teaching Gen Z in
Higher Education. Horizons Serie A, 26,
275–290. https://doi.org/10.20544/HORIZONS.A.26.3.20.P22
Di
Meo, F., & Martí-Ballester, C.-P. (2020). Effects of the perceptions of online quizzes and
electronic devices on student performance. Australasian Journal of
Educational Technology. https://doi.org/10.14742/ajet.4888
Drozdikova-Zaripova, A. R., & Sabirova, E. G. (2020). Usage
of Digital Educational Resources in Teaching Students with Application of
“Flipped Classroom” Technology. Contemporary Educational Technology, 12(2),
ep278. https://doi.org/10.30935/cedtech/8582
Estrada-Molina, O., Fuentes-Cancell, D. R., & Morales, A. A. (2022). The assessment
of the usability of digital educational resources: An interdisciplinary
analysis from two systematic reviews. Education and Information Technologies,
27(3), 4037–4063. https://doi.org/10.1007/s10639-021-10727-5
Federo, R., & Saz-Carranza, A.
(2018). A configurational analysis of board involvement in intergovernmental
organizations. Corporate Governance: An International Review, 26(6),
414–428. https://doi.org/https://doi.org/10.1111/corg.12241
Ferrando
Rodríguez, L., Gabarda-Mendez, V., Marin Suelves, D., & Ramón-Llin Más, J. (2023). ¿Crea contenidos digitales el
profesorado universitario? Un diseño mixto de investigación. Pixel-Bit.
Revista de Medios y Educación, 66, 137–172. https://doi.org/10.12795/pixelbit.96309
Fiss, P. C. (2011). Building
better causal theories: A fuzzy set approach to typologies in organizational
research. Academy of Management Journal, 54, 393–420. https://doi.org/10.5465/AMJ.2011.60263120
Greckhamer, T., Misangyi, V. F., &
Fiss, P. C. (2013). Chapter 3 The Two QCAs: From a Small-N to a Large-N Set
Theoretic Approach. In P. C. Fiss, B. Cambré, &
A. Marx (Eds.), Configurational Theory and Methods in Organizational
Research (Vol. 38, pp. 49–75). Emerald Group Publishing Limited. https://doi.org/10.1108/S0733-558X(2013)0000038007
Gutiérrez-González,
C., Montero, L., Espitia, L., & Torres, Y. (2023). Análisis de la
producción científica relacionada con Recursos Educativos Digitales (RED) y Objetos
Virtuales de Aprendizaje (OVA), entre 2000 – 2021. Revista de Investigación
Educativa, 41(1), 263–280. https://doi.org/10.6018/rie.518741
Hasan,
R., Palaniappan, S., Mahmood, S., Abbas, A., Sarker, K. U., & Sattar, M.
U. (2020). Predicting Student Performance
in Higher Educational Institutions Using Video Learning Analytics and Data
Mining Techniques. Applied Sciences, 10(11), 3894. https://doi.org/10.3390/app10113894
Haxhi, I., & Aguilera, R.
V. (2017). An Institutional Configurational Approach to Cross-National
Diversity in Corporate Governance. Journal of Management Studies, 54(3),
261–303. https://doi.org/https://doi.org/10.1111/joms.12247
Kirschner, P. A., & De Bruyckere, P. (2017). The myths of the digital native and the multitasker. Teaching
and Teacher Education, 67, 135–142. https://doi.org/10.1016/J.TATE.2017.06.001
Latif, E., & Miles, S.
(2020). The Impact of Assignments and Quizzes on Exam Grades: A
Difference-in-Difference Approach. Journal of Statistics Education, 28(3),
289–294. https://doi.org/10.1080/10691898.2020.1807429
Maquilón Sánchez, J. J., Mirete Ruz,
A. B., García Sánchez, F. A., & Hernández Pina, F. (2013). Valoración de las
TIC por los estudiantes universitarios y su relación con los enfoques de
aprendizaje. Revista de Investigación Educativa, 31(2), 537–554. https://doi.org/10.6018/rie.31.2.151891
Ndiyae, N. M., Chaabi, Y., Lekdioui, K., & Lishou, C.
(2019). Recommending system for
digital educational resources based on learning analysis. Proceedings of the
New Challenges in Data Sciences: Acts of the Second Conference of the Moroccan
Classification Society. https://api.semanticscholar.org/CorpusID:85519277
Noetel, M., Griffith, S., Delaney, O., Sanders, T., Parker,
P., del Pozo Cruz, B., & Lonsdale, C. (2021). Video Improves Learning in
Higher Education: A Systematic Review. Review of Educational Research, 91(2),
204–236. https://doi.org/10.3102/0034654321990713
Okike, E. U., & Mogorosi, M. (2020). Educational Data
Mining for Monitoring and Improving Academic Performance at University Levels. International
Journal of Advanced Computer Science and Applications, 11(11). https://doi.org/10.14569/IJACSA.2020.0111171
Pappas, I. O., & Woodside,
A. G. (2021). Fuzzy-set Qualitative Comparative Analysis (fsQCA):
Guidelines for research practice in Information Systems and marketing. International
Journal of Information Management, 58, 102310. https://doi.org/10.1016/J.IJINFOMGT.2021.102310
Pérez
de Albéniz Iturriaga, A., Escolano Pérez, E., Pascual Sufrate,
M. T., Lucas Molina, B., & Sastre i Riba, S. (2015). Metacognición en un
proceso de aprendizaje autónomo y cooperativo en el aula universitaria. Contextos
Educativos, 18, 95–108. https://doi.org/10.18172/con.2576
Prensky,
M. (2001). Digital Natives, Digital Immigrants Part 1. On the Horizon, 9(5), 1–6. https://doi.org/10.1108/10748120110424816
Ragin, C. C. (2000). Fuzzy-Set
Social Science. University of Chicago Press.
Ragin, C. C. (2008). Redesigning
Social Inquiry: Fuzzy Sets and Beyond. University of Chicago Press. https://doi.org/10.7208/chicago/9780226702797.001.0001
Ragin, C. C., & Davey, S.
(2022). Fuzzy-set/Qualitative comparative analysis
4.0. In Department of Sociology, University of California. http://www.socsci.uci.edu/~cragin/fsQCA/software.shtml
Ragin, C. C., & Rihoux, B. (2004). Qualitative Comparative Analysis (QCA):
State of the Art and Prospects. Qualitative Methods, 3–13. https://doi.org/10.5281/zenodo.998222
Rozo, H., & Real, M.
(2019). Pedagogical guidelines for the creation of adaptive digital educational
resources: A review of the literature. Journal of Technology and Science
Education, 9(3), 308. https://doi.org/10.3926/jotse.652
Russo, I., & Confente, I. (2019). From dataset to qualitative
comparative analysis (QCA)—Challenges and tricky points: A research note on
contrarian case analysis and data calibration. Australasian Marketing
Journal, 27(2), 129–135. https://doi.org/https://doi.org/10.1016/j.ausmj.2018.11.001
Schneider, C. Q., & Wagemann, C. (2010). Standards of Good Practice in Qualitative Comparative
Analysis (QCA) and Fuzzy-Sets. Comparative Sociology, 9(3),
397–418. https://doi.org/https://doi.org/10.1163/156913210X12493538729793
Schwieger, D., & Ladwig,
C. (2018). Reaching and Retaining the Next Generation: Adapting to the
Expectations of Gen Z in the Classroom. Information Systems Education
Journal, 3, 16. http://iscap.info;http://isedj.org
Segura-Robles,
A., Parra-González, M., & Gallardo-Vigil, M.
(2020). Bibliometric and Collaborative
Network Analysis on Active Methodologies in Education. Journal of New
Approaches in Educational Research, 9(2), 259–274.
Soffer, T., & Cohen, A.
(2019). Students’ engagement characteristics predict success and completion of
online courses. Journal of Computer Assisted Learning, 35(3),
378–389. https://doi.org/10.1111/jcal.12340
Sotola, L. K., & Crede, M. (2021). Regarding Class
Quizzes: a Meta-analytic Synthesis of Studies on the Relationship Between
Frequent Low-Stakes Testing and Class Performance. Educational Psychology
Review, 33(2), 407–426. https://doi.org/10.1007/s10648-020-09563-9
Woodside, A. G. (2013). Moving
beyond multiple regression analysis to algorithms: Calling for a paradigm shift
from symmetric to asymmetric thinking in data analysis and crafting theory. Journal
of Business Research, 66, 463–472. https://doi.org/10.1016/j.jbusres.2012.12.021
Woodside, A. G. (2014). Embrace perform model: Complexity theory, contrarian case
analysis, and multiple realities. Journal of Business Research, 67(12),
2495–2503. https://doi.org/10.1016/j.jbusres.2014.07.006
Zadeh, L. A. (1965). Fuzzy
sets. Information and Control, 8(3), 338–353. https://doi.org/10.1016/S0019-9958(65)90241-X